|
| Inflation Protection Model Portfolio |
| Monthly Portfolio Review: May 2025Publication date: June 2, 2025 |
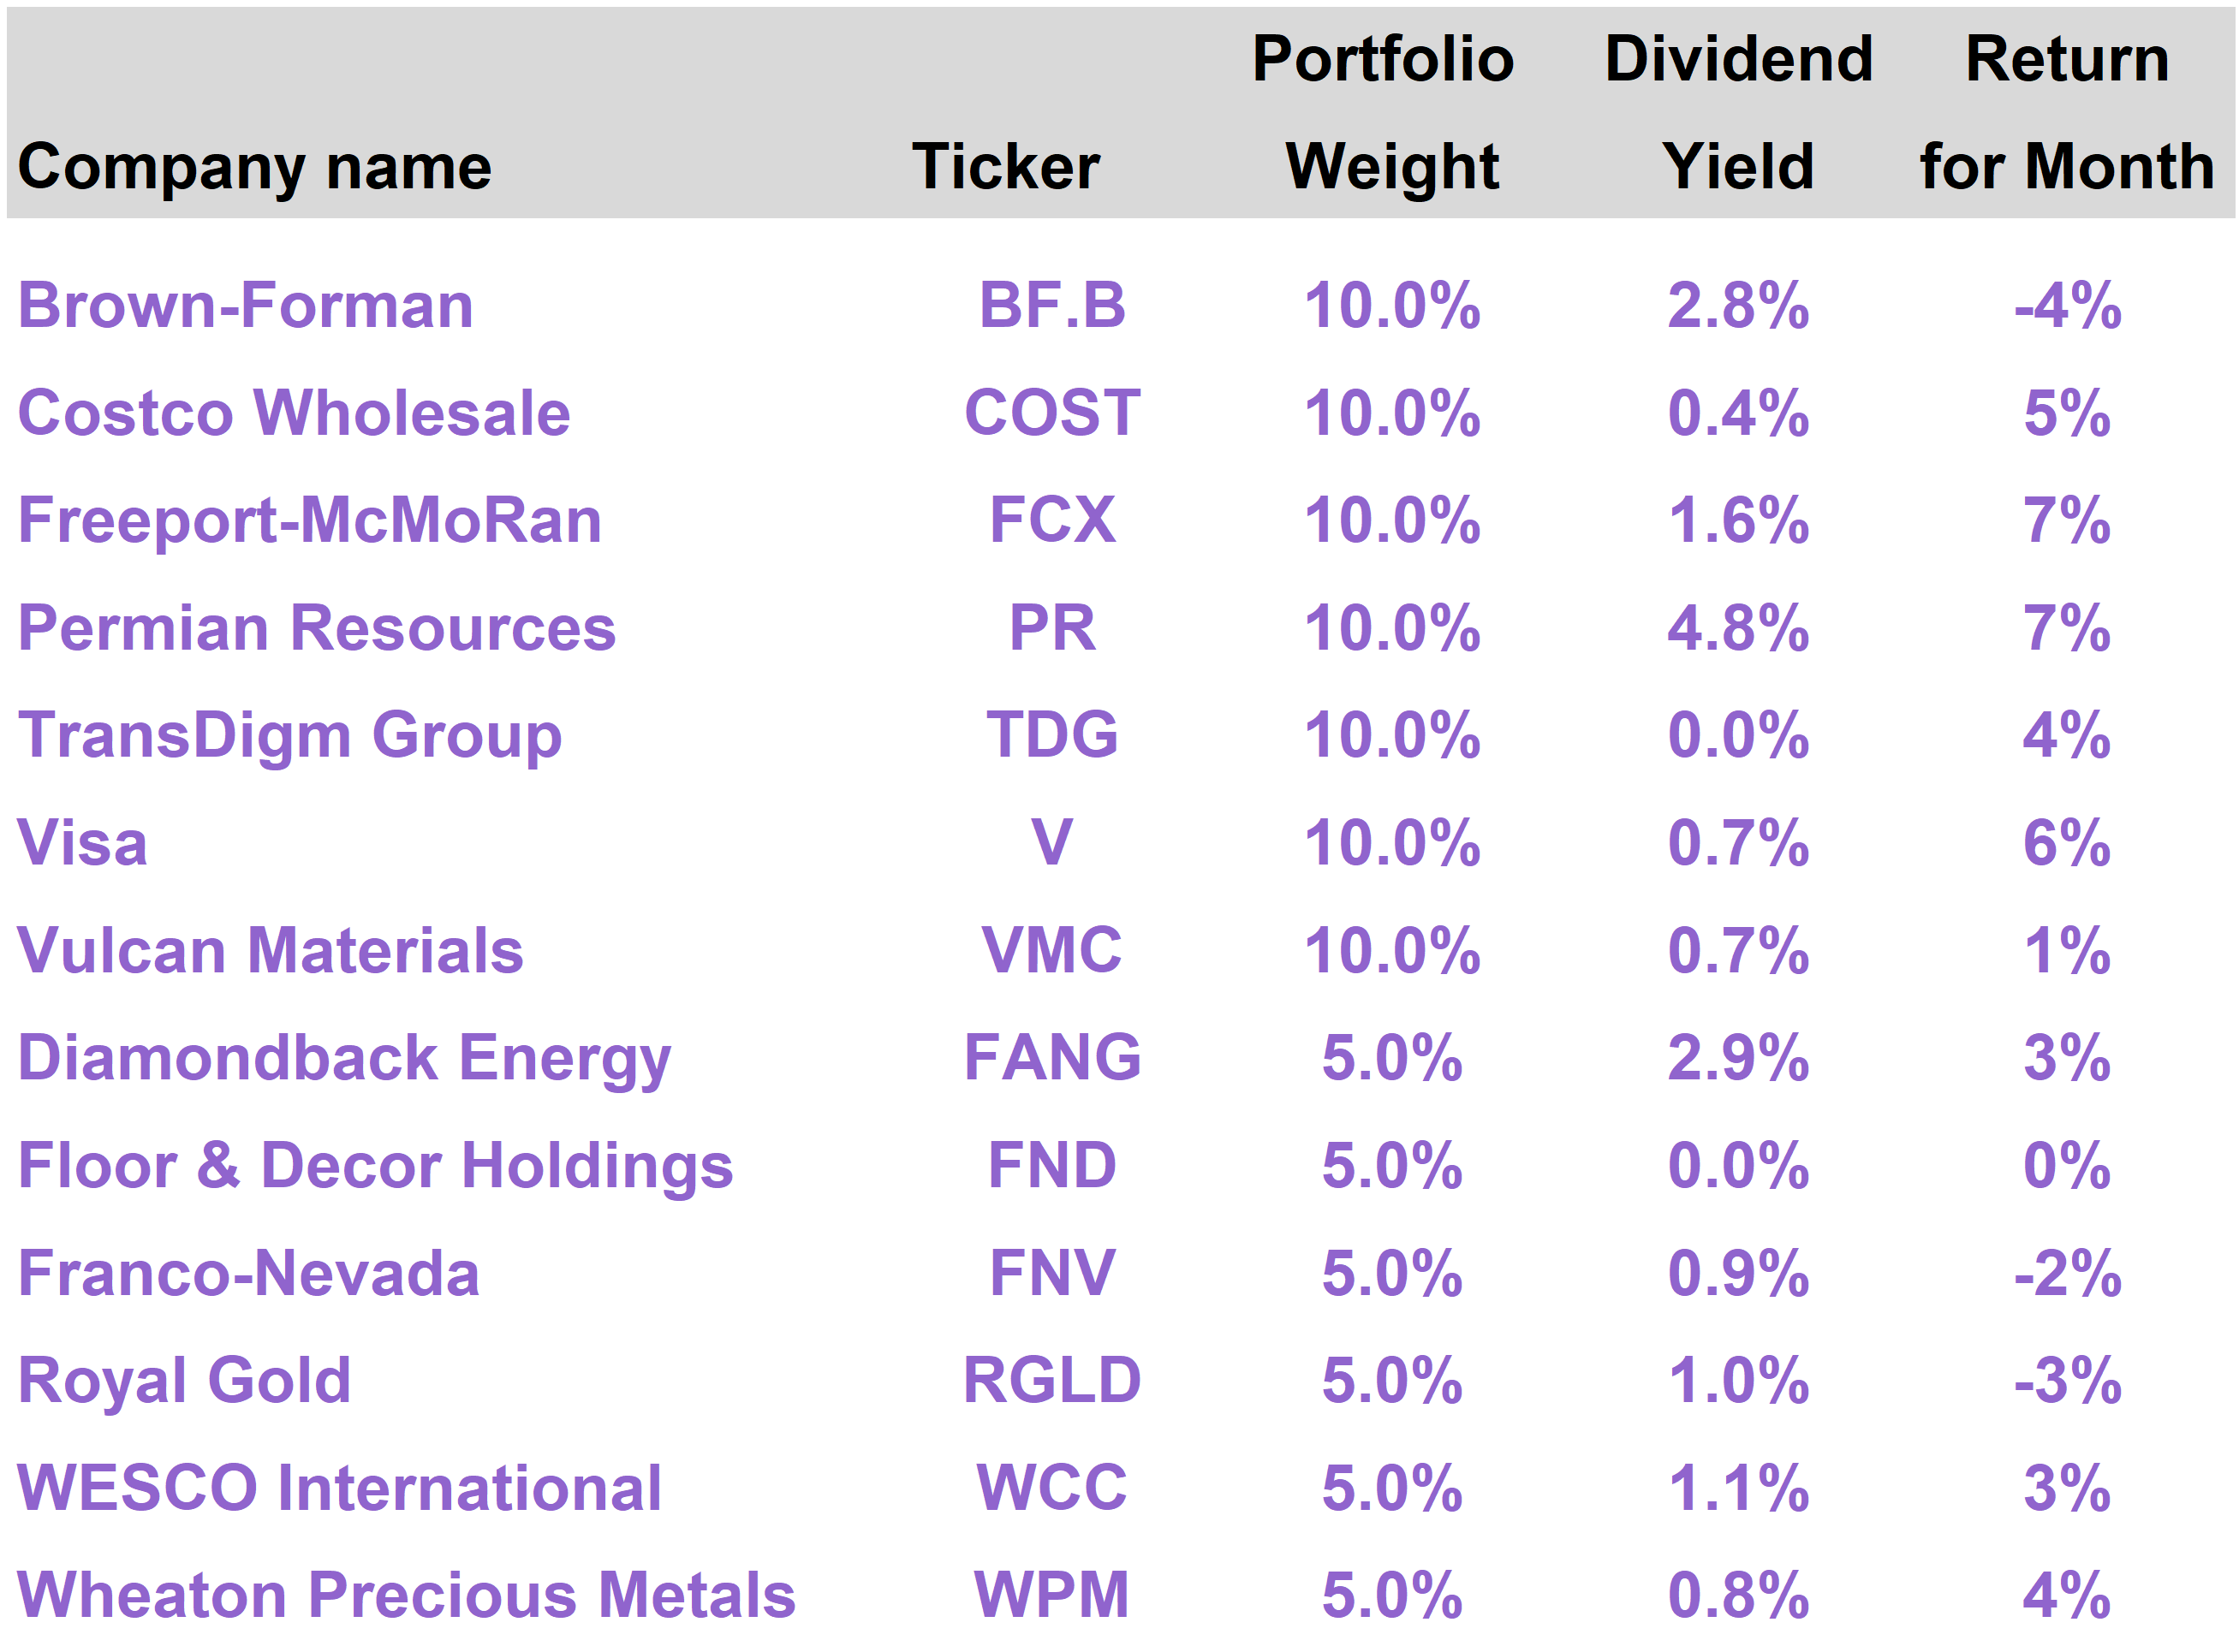
| | | Current portfolio holdings |
|
| | FOR SUBSCRIBER USE ONLY. DO NOT FORWARD OR SHARE. |
| | | Stocks showed continued strength in May as Trump moderated his position on tariffs and the AI theme recovered momentum. The Inflation Protection portfolio generated a total return of 2.8% this month. On a year to date basis, the portfolio has returned 6.3%, versus 1.1% for the S&P 500 Index. The top performing stock in the portfolio was Permian Resources (PR), which advanced 7% as oil prices moved slightly higher. Freeport McMoRan (FCX) shares also rose 7%, with copper prices recovering. The portfolio’s gold plays delivered mixed results; the price of gold was basically flat for the month. After an extremely volatile April, investors are now expressing a more optimistic outlook, especially in the tech sector. While gold has taken a backseat to risk assets in recent weeks, we continue to see gold as a beneficiary of long-term structural drivers.
|
| | | The Inflation Protection portfolio returned 2.8% in May, versus a total return of 6.3% for the S&P 500 Index. On a year to date basis through the end of May, the portfolio has delivered a total return of 6.3%, substantially ahead of the 1.1% return for the S&P 500.
The portfolio’s top performing stocks in May were Permian Resources (PR), which returned 7%; Freeport-McMoRan (FCX), which returned 7%; and Visa (V), which returned 6%.
The worst performing stocks were Brown-Forman (BF), which returned -4%; Royal Gold (RGLD), which returned -3%; and Franco-Nevada (FNV), which returned -2%. |
| A record-setting May
Last month, we talked about the extreme volatility that took place in April 2025 and the fact that stocks were only slightly down by the end of the month.
The strong recovery that kicked off right after Trump’s “90 day PAUSE” social media post, which first hit Truth Social around 1:30pm on April 9, continued through May.
The S&P 500 advanced 6.3% in May, while the tech-heavy NASDAQ Composite Index soared 9.7%.
It is important to emphasize: these are very large numbers for stock index performance in a single month. The average return in any month is typically less than 1%.
The last time the S&P 500 rose so much during the month of May was 1990.
This was also the best monthly performance result for the index since November 2023, which marked the start of a market uptrend that has since produced a total return of approximately 41% (10/31/2023 to 5/31/2025).
Although both the S&P 500 and the NASDAQ remain a few percentage points below their highest levels from February, they are roughly flat for the year. The S&P 500 is up 1.1%, while the NASDAQ has declined 0.7%. |
|
| S&P 500 and NASDAQ CompositeTotal Return (12/31/24 - 5/31/25) |
| We noted last month the extreme swing in the CBOE Market Volatility Index (VIX), also known as the “fear index,” which measures expected volatility in the S&P 500 Index over the next 30 days.
The VIX spiked through 50 on April 8, the day before the tariff pause. The VIX reached levels in April that were only seen over the past 20 years during the height of the pandemic and the 2008 financial crisis.
In May, the VIX receded sharply. It ended the month below 20, which is within its normal trading range when markets are settled. |
|
| CBOE Market Volatility Index (VIX)(Last 2 Years) |
| Tariff anxiety subsides
Stocks slid in early April, following Trump’s Liberation Day announcements, because investors were uncertain how far Trump would actually take tariffs. Tariffs on China were initially set at such high levels that trade between the two largest economies in the world would be effectively frozen.
It was widely understood that Trump viewed tariffs as a negotiation tool, and there would be room for compromise.
Yet he and key advisors (like Peter Navarro) were also speaking at the time about generating hundreds of billions of dollars of revenue through tariffs, implying they could stay in place at high rates.
Trump’s decision to pause on April 9 and subsequent moderations of his position (including another pause on tariffs on China that was announced May 12) have provided investors with a certain degree of comfort that Trump’s tariff policy, wherever it ultimately lands, will probably be reasonable.
If the ultimate tariff outcome is moderate, this substantially reduces the perceived risk of a growth slowdown that could potentially lead to a recession. It also reduces the risk of a financial market calamity that could be triggered by a severe interruption of global trade.
Optimism returns
As worst case tariff scenarios get taken off the table, attention has returned to more positive things happening in the global economy, especially within the AI theme.
AI is what propelled markets to new heights before markets started to price in tariff-related risk towards the end of February. Trump’s election only strengthened investor enthusiasm for AI-related stocks because of his clear commitment to promoting AI development through deregulation.
Possibly the most important thing the federal government can do to advance AI is to provide a regulatory environment that facilitates the construction of AI data centers.
The supercomputers housed in these data centers require vast amounts of electrical power. The federal government plays a critical role when it comes to permitting new power plants and related energy infrastructure, such as high voltage transmission lines.
Donald of Arabia
The Trump administration’s mid-May trip to the Middle East flipped the script on the market narrative.
After Liberation Day, investors perceived Trump as trying to withdraw from the global trading system and disengage from other nations.
Trump spent four days visiting Saudi Arabia, Qatar and United Arab Emirates, some of the most strategically important nations in the world by virtue of their vast energy resources and immense financial capacity.
Trump inked deals that not only solidified these trading and security relationships but substantially advanced the interests of U.S. technology companies.
Saudi Arabia committed to $600 billion of investments in the U.S., including a $20 billion pledge to fund data centers and AI-related infrastructure through a Saudi-backed tech concern called DataVolt.
U.S. companies will also be providing equipment for AI data centers in Saudi Arabia and other infrastructure projects.
Several American companies will benefit directly from these diplomatic efforts, including Oracle (ORCL), Alphabet (GOOGL), Salesforce (CRM), AMD (AMD), and GE Vernova (GEV).
NVIDIA (NVDA) was a particularly big winner.
NVDA announced a landmark deal with Saudi Arabia, primarily through the Saudi firm Humain (a subsidiary of the country’s nearly trillion dollar Public Investment Fund). NVDA will supply over 18,000 of its latest Blackwell AI chips for deployment in a 500-megawatt data center project.
NVDA will thereafter deliver several hundred thousand of its most advanced Graphic Processing Units (GPUs) to Saudi Arabia over the next five years as part of a broader plan to establish the energy-rich kingdom as a global leader in AI. |
|
| Trump, Saudi Crown Prince MBS, NVIDIA CEO Jensen Huang (5/13/2025) |
| The Donald Trump that terrified the investment world in early April—erecting trade barriers and disrupting global commerce—transformed within a matter of weeks into a high-tech dealmaker, securing long-term opportunities for some of America’s most important companies.
After the trip, there was some pushback on national security grounds related to all this deal activity and the proposed deployment of advanced American technology in the Middle East.
The chief concern is that China, through its relationships with these countries, could obtain NVDA GPUs and other valuable intellectual property.
AI and Crypto Czar David Sacks, who was part of the delegation on the Middle East trip, offered a strong defense. There will be robust safeguards on the technology provided, which in the case of GPUs are in fact large and heavy pieces of equipment that cannot be readily smuggled.
The deals also mean that these Middle East players will be standardizing around American technology, rather than Chinese technology. This is an especially important point given that AI as an industry is just in its infancy. |
| | The question is, who do we want these countries to partner with? If we reject them, we’re going to drive them into the arms of China, and China would love to sell the chips to these countries. We will create a Huawei Belt and Road if we don’t enable their AI dreams and aspirations, so I think it’d be a major mistake to reject them. - David Sacks (5/20/2025) |
| | Good earnings, too
In addition to positive shifts on the political front, several earnings reports came through in May that reignited investor interest in the AI theme.
At the very end of last month, after the market closed on 4/30/2025, Microsoft (MSFT) announced strong earnings results that were driven to a large extent by AI adoption. The shares rose nearly 8% the next day.
On May 22, Intuit (INTU), a diversified software provider with a market cap in excess of $200 billion, also reported solid earnings growth and lifted guidance, which sent shares up more than 8% the next day.
INTU, in contrast with a company like NVDA, is not an AI supplier but rather uses AI to make its various products and services more effective and efficient.
INTU’s CEO Sasan Goodarzi declared that the company is “redefining what's possible with AI by becoming a one-stop shop of AI-agents and AI-enabled human experts to fuel the success of consumers and small and mid-market businesses.”
On May 28, NVDA also reported strong results that sent the shares up sharply the next day.
Despite losing out on billions of dollars of potential sales as a result of new export restrictions to China, NVDA’s guidance for next quarter’s revenue was above expectations, driven by broad-based demand for its industry-leading AI technology. |
| Tech leads the way
Given the positive tech-related news flow, it may come as no surprise that Technology was the best performing sector within the S&P 500 Index in May, advancing 10%.
Tech is the largest sector, representing more than 30% of total market capitalization, and helped fuel the overall 6% increase in the index.
Industrial stocks, many of which are geared towards the AI buildout, also performed well, advancing 9%. Tech platform companies Amazon (AMZN) and Tesla (TSLA) are classified as Consumer Discretionary and drove performance in that sector, which rose 8%.
As investors rotated into growth and cyclicals with a more bullish outlook for the economy, more defensive sectors like Consumer Staples (+1%), Real Estate (+1%), and Health Care (-6%) were laggards. |
|
| | Risks do remain
Trump has definitely not given up on tariffs entirely. Negotiations under the leadership of Treasury Secretary Scott Bessent appear to be going well, but investors should be prepared for negative headlines and setbacks.
While stocks performed well in May, markets had to absorb a credit downgrade on the United States from Moody’s, which we discussed in the 76report (Moody’s Downgrade: Minor Event but Useful Reminder).
Moody’s was the last of the three major credit rating agencies to have awarded the U.S. the highest rating within its classification system. The downgrade is largely symbolic in that it did not lead to any forced selling but highlights a problem that is not simply going away on its own.
The U.S. continues to bear the burden of unsustainably large federal debt and growing entitlement liabilities. Congress seems to have limited appetite to address it.
Yields on 10-year Treasuries ended May around 4.4%, roughly in the middle of the range in which yields have traded throughout 2025.
Any upward pressure on long-term rates, potentially driven by bond investors demanding higher returns as compensation for the bleak fiscal outlook, could have a negative impact on stock prices. |
|
| 10-Year Treasury Yield - Last 12 Months(Source: FactSet) |
| On the other hand, the likeliest solution to the long-term fiscal problem is some variation of Quantitative Easing (QE), where the Fed essentially prints money to monetize the debt and prevent interest rates from rising to a level that imperils the U.S. economy.
After significant volatility in April, Bitcoin reached new highs in May, getting to just below $112,000 on May 22. Among the variables driving up the price of Bitcoin is the prospect of potential dilution of the U.S. dollar via monetary policy.
As bond investors become increasingly wary of the real value of the fiat money with which they will be repaid in the distant future, capital continues to flow into Bitcoin as a hedge.
Like Bitcoin and gold, stocks represent claims to real economic assets and are therefore a long-term hedge on dollar debasement. As more dollars circulate in the economy, companies have greater flexibility to raise prices to grow their earnings. |
| | | The top performing stocks in the Inflation Protection portfolio in May were Permian Resources (PR), which returned 7%; Freeport-McMoRan (FCX), which returned 7%; and Visa (V), which returned 6%.
The most significant portfolio detractors this month were Brown-Forman (BF), which returned -4%; Royal Gold (RGLD), which returned -3%; and Franco-Nevada (FNV), which returned -2%. |
| PR shares recovered somewhat as oil prices modestly advanced in May following sharp declines in April. The portfolio’s other oil and gas exploration and production play, Diamondback Energy (FANG), delivered a 3% return for the month. |
|
| NYMEX Crude Oil - Last 12 Months |
| While energy price fluctuations will inevitably have a major impact on the performance of energy stocks, especially E&P names, we continue to view PR as a particularly attractive opportunity within the sector.
PR reported solid first quarter earnings in May, with production volumes slightly ahead of expectations. The company also disclosed a $600 million bolt-on acquisition within its territory.
Capital efficiency is key to the PR story.
With oil prices lower, PR has modestly reduced its capital spending forecasts. Meanwhile, amidst the volatility in April, the company repurchased 4.1 million shares at an average price of $10.52 per share, meaningfully below current levels.
PR also strengthened its balance sheet and retired approximately $175 million of debt during the quarter through internally generated cash flow.
Even with oil around $60 per barrel, PR appears substantially undervalued on a discounted cash flow basis. Naturally, any improvement in oil prices from current low levels would boost PR’s cash generation potential.
PR is a relatively small player with an attractive footprint in a desirable geography and trades at discounted valuation metrics relative to larger peers. As such, the company remains a likely long-term take-out play.
From a dividend perspective, the most recently declared base quarterly dividend of $0.15 translates into an attractive 5% yield.
Shares of FCX advanced as copper prices recovered from sharp but fleeting declines in early April. FCX is a leading copper miner and a beneficiary of Trump administration efforts to protect domestic copper production. |
|
| Copper (US$ per Ton) - Last 24 Months |
| The long-term investment case for copper is based on persistently growing demand related to electrical applications, paired with constrained supply growth. From a shorter term perspective, copper prices may benefit from continued demand from AI-related projects, Chinese stimulus and a weaker dollar.
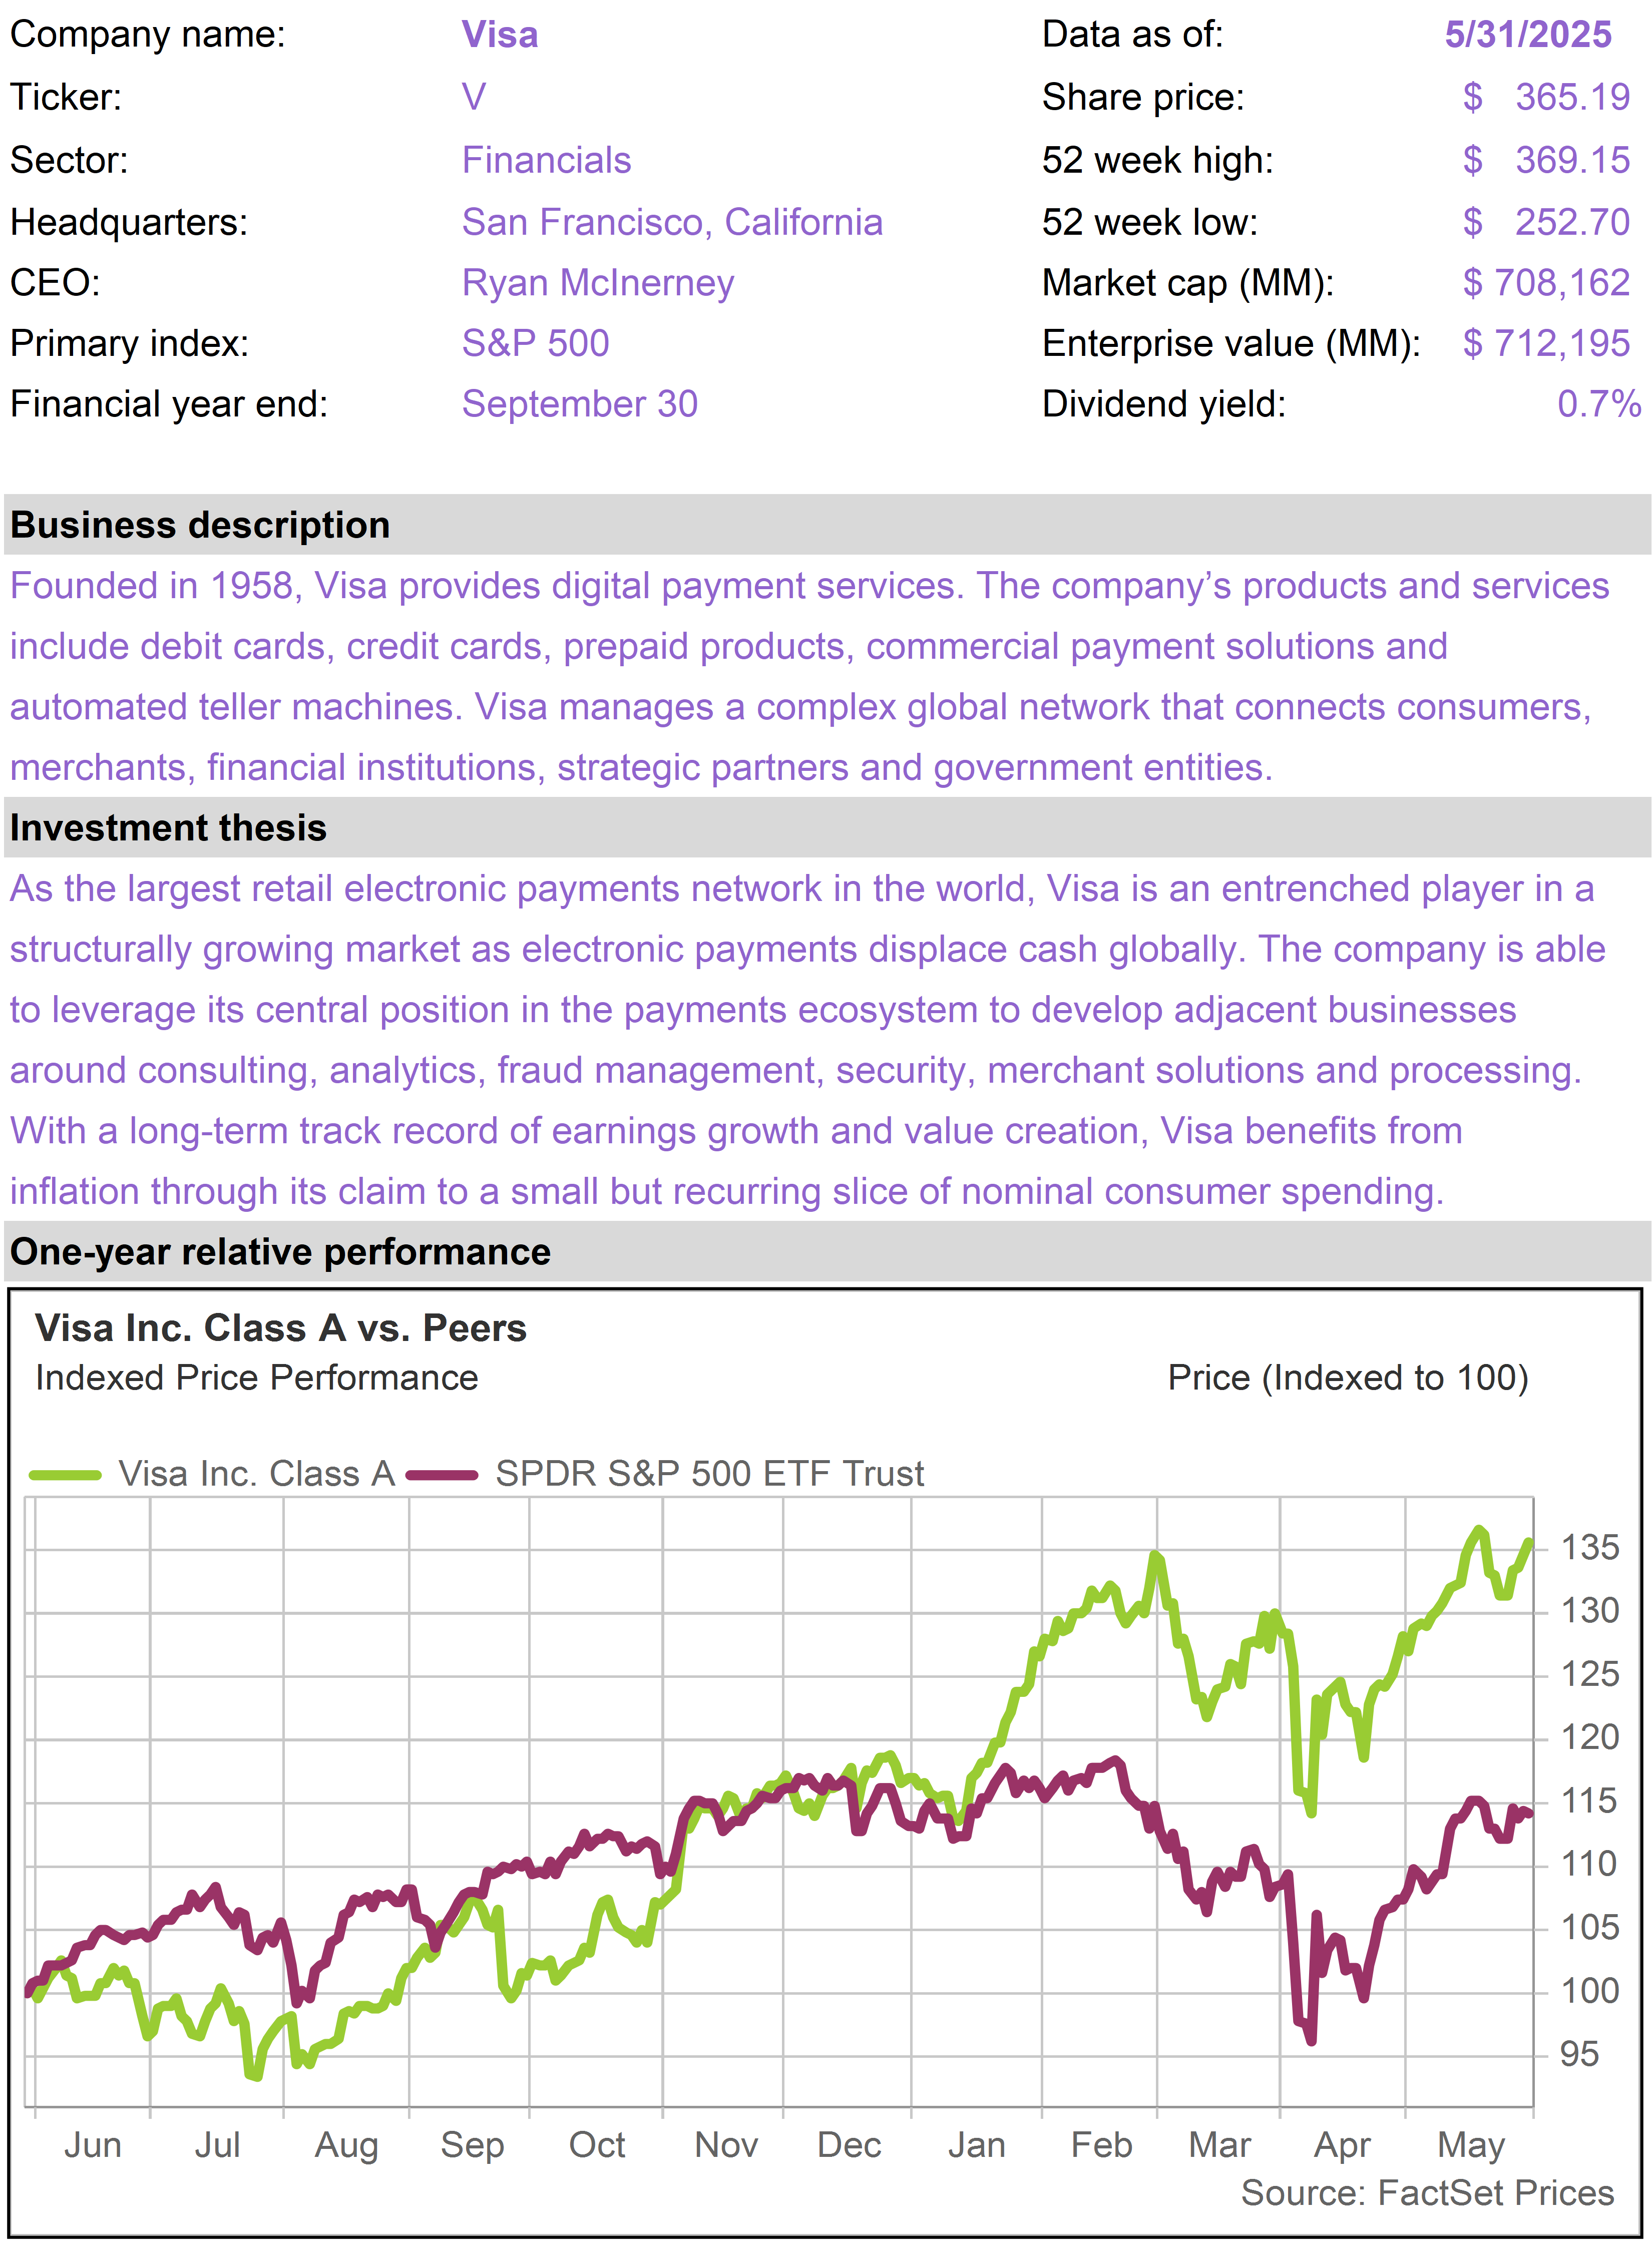
V continues to deliver for shareholders. As we noted last month, the company reported no meaningful deterioration in customer spending patterns, despite market volatility.
V continues to leverage its market leadership in payment processing in new areas, including crypto and AI. The company’s “Visa as a Service” initiative, which was discussed at its most recent investor day and includes its more technologically advanced offerings, now represents some 30% of total revenue and is growing at about a 20% rate.
BF shares declined slightly as investors rotated away from more defensive consumer plays.
The portfolio’s gold-streaming plays have been key contributors to the portfolio on a year to date basis. While RGLD and FNV declined modestly in May, Wheaton Precious Metals (WPM) advanced by 4%.
Gold peaked in the aftermath of the April volatility and has traded within the $3,200 to $3,400 per ounce range since. Gold was largely flat in May, ending the month close to $3,300. |
|
| Gold Price (US$ per Ounce) - Year to Date |
| As capital flows back into technology stocks and risk-on assets, gold and gold-related investments are underperforming. It is worth noting, however, gold has stabilized, rather than retreated, as market conditions have normalized.
We continue to favor allocations to gold and gold-related investments. Governments and private investors around the world continue to seek alternatives to U.S. dollar assets. The U.S. government itself appears to favor a weaker dollar to reduce trade deficits. |
| | |
| | |
| | |
| | | |
|
| | |
|
| | |
|
| | |
|
| | |
|
| | |
|
| | |
|
| | Diamondback Energy (FANG) |
|
|
| | Floor & Decor Holdings (FND) |
|
|
| | |
|
| | |
|
| | WESCO International (WCC) |
|
|
| | Wheaton Precious Metals (WPM) |
|
|
| | The 76research Inflation Protection Model Portfolio emphasizes business models that are expected to perform well on a relative basis in periods of elevated inflation. Holdings are typically selected from industries based on supply constrained real assets, including commodity and energy businesses, or companies that otherwise demonstrate superior pricing power. Drawing from an investable universe of expected inflation beneficiaries, specific holdings are chosen based on valuation and general business quality, growth and risk considerations. |
| | FOR SUBSCRIBER USE ONLY. DO NOT FORWARD OR SHARE. |
| | | |
|
|
|
|
| |
|