Income Builder
*|MC:SUBJECT|*
͏ ‌     ͏ ‌     ͏ ‌     ͏ ‌     ͏ ‌     ͏ ‌     ͏ ‌     ͏ ‌     ͏ ‌     ͏ ‌     ͏ ‌     ͏ ‌     ͏ ‌     ͏ ‌     ͏ ‌     ͏ ‌     ͏ ‌     ͏ ‌     ͏ ‌     ͏ ‌     ͏ ‌     ͏ ‌     ͏ ‌     ͏ ‌     ͏ ‌     ͏ ‌     ͏ ‌     ͏ ‌     ͏ ‌     ͏ ‌     ͏ ‌     ͏ ‌     ͏ ‌     ͏ ‌     ͏ ‌     ͏ ‌     ͏ ‌     ͏ ‌     ͏ ‌     ͏ ‌     ͏ ‌     ͏ ‌     ͏ ‌     ͏ ‌     ͏ ‌     ͏ ‌     ͏ ‌     ͏ ‌     ͏ ‌     ͏ ‌     ͏ ‌     ͏ ‌     ͏ ‌     ͏ ‌     ͏ ‌     ͏ ‌     ͏ ‌     ͏ ‌     ͏ ‌     ͏ ‌     ͏ ‌     ͏ ‌     ͏ ‌     ͏ ‌     ͏ ‌     ͏ ‌     ͏ ‌     ͏ ‌     ͏ ‌     ͏ ‌     ͏ ‌     ͏ ‌     ͏ ‌     ͏ ‌     ͏ ‌     ͏ ‌     ͏ ‌     ͏ ‌     ͏ ‌     ͏ ‌     ͏ ‌     ͏ ‌     ͏ ‌     ͏ ‌     ͏ ‌     ͏ ‌     ͏ ‌     ͏ ‌     ͏ ‌     ͏ ‌     ͏ ‌     ͏ ‌     ͏ ‌     ͏ ‌     ͏ ‌     ͏ ‌     ͏ ‌     ͏ ‌     ͏ ‌     ͏ ‌     ͏ ‌     ͏ ‌     ͏ ‌     ͏ ‌     ͏ ‌     ͏ ‌     ͏ ‌     ͏ ‌     ͏ ‌     ͏ ‌     ͏ ‌     ͏ ‌     ͏ ‌     ͏ ‌     ͏ ‌     ͏ ‌     ͏ ‌     ͏ ‌     ͏ ‌     ͏ ‌     ͏ ‌     ͏ ‌     ͏ ‌     ͏ ‌     ͏ ‌     ͏ ‌     ͏ ‌     ͏ ‌     ͏ ‌     ͏ ‌     ͏ ‌     ͏ ‌     ͏ ‌     ͏ ‌     ͏ ‌     ͏ ‌     ͏ ‌     ͏ ‌     ͏ ‌     ͏ ‌     ͏ ‌     ͏ ‌     ͏ ‌     ͏ ‌     ͏ ‌     ͏ ‌     ͏ ‌     ͏ ‌     ͏ ‌     ͏ ‌     ͏ ‌     ͏ ‌     ͏ ‌     ͏ ‌     ͏ ‌     ͏ ‌     ͏ ‌     ͏ ‌     ͏ ‌     ͏ ‌     ͏ ‌     ͏ ‌     ͏ ‌     ͏ ‌     ͏ ‌     ͏ ‌     ͏ ‌     ͏ ‌     ͏ ‌     ͏ ‌     ͏ ‌     ͏ ‌     ͏ ‌     ͏ ‌     ͏ ‌     ͏ ‌     ͏ ‌     ͏ ‌     ͏ ‌     ͏ ‌     ͏ ‌     ͏ ‌     ͏ ‌     ͏ ‌     ͏ ‌     ͏ ‌     ͏ ‌     ͏ ‌     ͏ ‌     ͏ ‌     ͏ ‌     ͏ ‌     ͏ ‌     ͏ ‌     ͏ ‌     ͏ ‌     ͏ ‌     ͏ ‌     ͏ ‌     ͏ ‌     ͏ ‌     ͏ ‌     ͏ ‌     ͏ ‌     ͏ ‌     ͏ ‌     ͏ ‌     ͏ ‌     ͏ ‌     ͏ ‌     ͏ ‌     ͏ ‌     ͏ ‌     ͏ ‌     ͏ ‌     ͏ ‌     ͏ ‌     ͏ ‌     ͏ ‌     ͏ ‌     ͏ ‌     ͏ ‌     ͏ ‌     ͏ ‌     ͏ ‌     ͏ ‌     ͏ ‌     ͏ ‌     ͏ ‌     ͏ ‌     ͏ ‌     ͏ ‌     ͏ ‌     ͏ ‌     ͏ ‌     ͏ ‌     ͏ ‌     ͏ ‌     ͏ ‌     ͏ ‌     ͏ ‌     ͏ ‌     ͏ ‌     ͏ ‌     ͏ ‌     ͏ ‌     ͏ ‌     ͏ ‌     ͏ ‌     ͏ ‌     ͏ ‌     ͏ ‌     ͏ ‌     ͏ ‌     ͏ ‌     ͏ ‌     ͏ ‌     ͏ ‌     ͏ ‌     ͏ ‌     ͏ ‌     ͏ ‌     ͏ ‌     ͏ ‌     ͏ ‌     ͏ ‌     ͏ ‌     ͏ ‌     ͏ ‌     ͏ ‌     ͏ ‌     ͏ ‌     ͏ ‌     ͏ ‌     ͏ ‌     ͏ ‌     ͏ ‌     ͏ ‌     ͏ ‌     ͏ ‌     ͏ ‌     ͏ ‌     ͏ ‌     ͏ ‌     ͏ ‌     ͏ ‌     ͏ ‌     ͏ ‌     ͏ ‌     ͏ ‌     ͏ ‌     ͏ ‌     ͏ ‌     ͏ ‌     ͏ ‌     ͏ ‌     ͏ ‌     ͏ ‌     ͏ ‌     ͏ ‌     ͏ ‌     ͏ ‌     ͏ ‌     ͏ ‌     ͏ ‌     ͏ ‌     ͏ ‌     ͏ ‌     ͏ ‌     ͏ ‌     ͏ ‌     ͏ ‌     ͏ ‌     ͏ ‌     ͏ ‌     ͏ ‌     ͏ ‌     ͏ ‌     ͏ ‌     ͏ ‌    ­ ­ ­ ­ ­ ­ ­ ­ ­ ­ ­ ­ ­ ­ ­ ­ ­ ­ ­ ­ ­ ­ ­ ­ ­ ­ ­ ­ ­ ­ ­ ­ ­ ­ ­ ­ ­ ­ ­ ­ ­ ­ ­ ­ ­ ­ ­ ­ ­ ­ ­ ­ ­ ­ ­ ­ ­ ­ ­ ­ ­ ­ ­ ­ ­ ­ ­ ­ ­ ­ ­ ­ ­ ­ ­ ­ ­ ­ ­ ­ ­ ­ ­ ­ ­ ­ ­ ­ ­ ­ ­ ­ ­ ­ ­ ­ ­ ­ ­ ­ ­ ­ ­ ­ ­ ­ ­ ­ ­ ­ ­ ­ ­ ­ ­ ­ ­ ­ ­ ­ ­ ­ ­ ­ ­ ­ ­ ­ ­ ­ ­ ­ ­ ­ ­ ­ ­ ­ ­ ­ ­ ­ ­ ­ ­ ­ ­ ­ ­ ­ ­ ­ ­ ­ ­ ­ ­ ­ ­ ­ ­ ­ ­ ­ ­ ­ ­ ­ ­ ­ ­ ­ ­ ­ ­ ­ ­ ­ ­ ­ ­ ­ ­ ­ ­ ­ ­ ­ ­ ­ ­ ­ ­ ­ ­ ­ ­ ­ ­ ­ ­ ­ ­ ­ ­ ­ ­ ­ ­ ­ ­ ­ ­ ­ ­ ­ ­ ­ ­ ­ ­ ­ ­ ­ ­ ­ ­ ­ ­ ­ ­ ­ ­ ­ ­ ­ ­ ­ ­ ­ ­ ­ ­ ­ ­ ­ ­ ­ ­ ­ ­ ­ ­ ­ ­ ­ ­ ­ ­ ­ ­ ­ ­ ­ ­ ­ ­ ­ ­ ­ ­ ­ ­ ­ ­ ­ ­ ­ ­ ­ ­ ­

Income Builder Model Portfolio

Monthly Portfolio Review: November 2025

Publication date: December 2, 2025

Current portfolio holdings

FOR SUBSCRIBER USE ONLY. DO NOT FORWARD OR SHARE.

Executive summary

  • November was a volatile month, although the S&P 500 ended up marginally higher despite sharp mid-month declines.

  • Technology and AI stocks traded off after several months of outperformance.

  • Volatility was partly driven by concerns over a potential pause to Fed interest rate cuts.

  • The Income Builder portfolio generated a return of 2.4%, versus 0.3% for the S&P 500 Index and -1.5% for the Nasdaq Composite Index.

  • Portfolio performance was led by Permian Resources (PR), which delivered a total return of 15% on the heels of strong quarterly earnings results.

  • During the month, investors rotated toward previously underperforming sectors.

  • As investors redirect their attention to relatively low valuations outside of technology, portfolio holdings in these sectors stand to benefit.

Performance review

The Income Builder portfolio returned 2.4% in November, while the S&P 500 Index returned 0.3%. On a year to date basis, the portfolio has generated a total return of 2.7%, versus 17.8% for the index.


The top performing positions in the portfolio in November were Permian Resources (PR), which returned 15%; Diamondback Energy (FANG), which returned 7%; and Mid-America Apartments (MAA), which returned 6%.


Two positions in the portfolio generated negative returns this month. Digital Realty Trust (DLR) returned -6%, and VICI Properties (VICI) returned -4%.


A volatile month


While the S&P 500 did slightly advance in November, it was a highly volatile month, marked by sharp declines in tech stocks, especially those related to the AI-buildout theme. The tech-heavy Nasdaq Composite Index underperformed the S&P 500 and returned -1.5% this month.


While the month ended up more or less flat, performance was in fact much worse toward the middle of the month. At their lowest levels on November 20, the S&P 500 and the Nasdaq were down 4.4% and 6.9% respectively from the end of October.


S&P 500 and NASDAQ Composite

Total Return (10/31/25 - 11/30/25)


“AI jitters”


We noted last month that it was possible that fiscal year-end window dressing contributed to the sharp tech outperformance we saw in October. Most stock funds end their fiscal years on October 31.


The idea was that fund managers were scrambling to add top performers (especially AI winners) to their portfolios by the end of the month. To the extent that happened, it raises the possibility that this non-fundamental demand driver disappeared in November.


It is sometimes hard to read what exactly drives market movements. This month was arguably more difficult than others.


Often, there are clear market events that we can point to, such as the Liberation Day tariff announcements that sent stocks reeling in early April. In November, there was not an obvious or direct explanation for the tech-led mid-month sell-off.


Many financial media headlines made reference to “AI jitters”—in other words, the market reconsidering the sustainability of the AI infrastructure boom.


But even after NVIDIA (NVDA) reported genuinely strong earnings results on November 19, which initially lifted markets, the selling pressure continued, at least for another day, before seeming to exhaust itself.


The AI bubble debate resurfaced in November. This could have been either a cause or a result of the decline in tech stocks… or a little of both.


In other words, were investors selling stocks because they feared an AI bubble? Or were they talking about an AI bubble simply because tech stocks were correcting after several months of strong outperformance?


What matters ultimately is how these companies perform in the years ahead, not what the market mood meter read at some point along the way. Investors should always anchor to long-term expectations for profitability.


Are rate cuts done?


Alongside AI-related anxiety, the market became preoccupied in November with statements from various Federal Reserve officials. Ever since the Jackson Hole meeting in August, investors have been counting on a trajectory of incremental rate cuts. But in November, doubts surfaced.


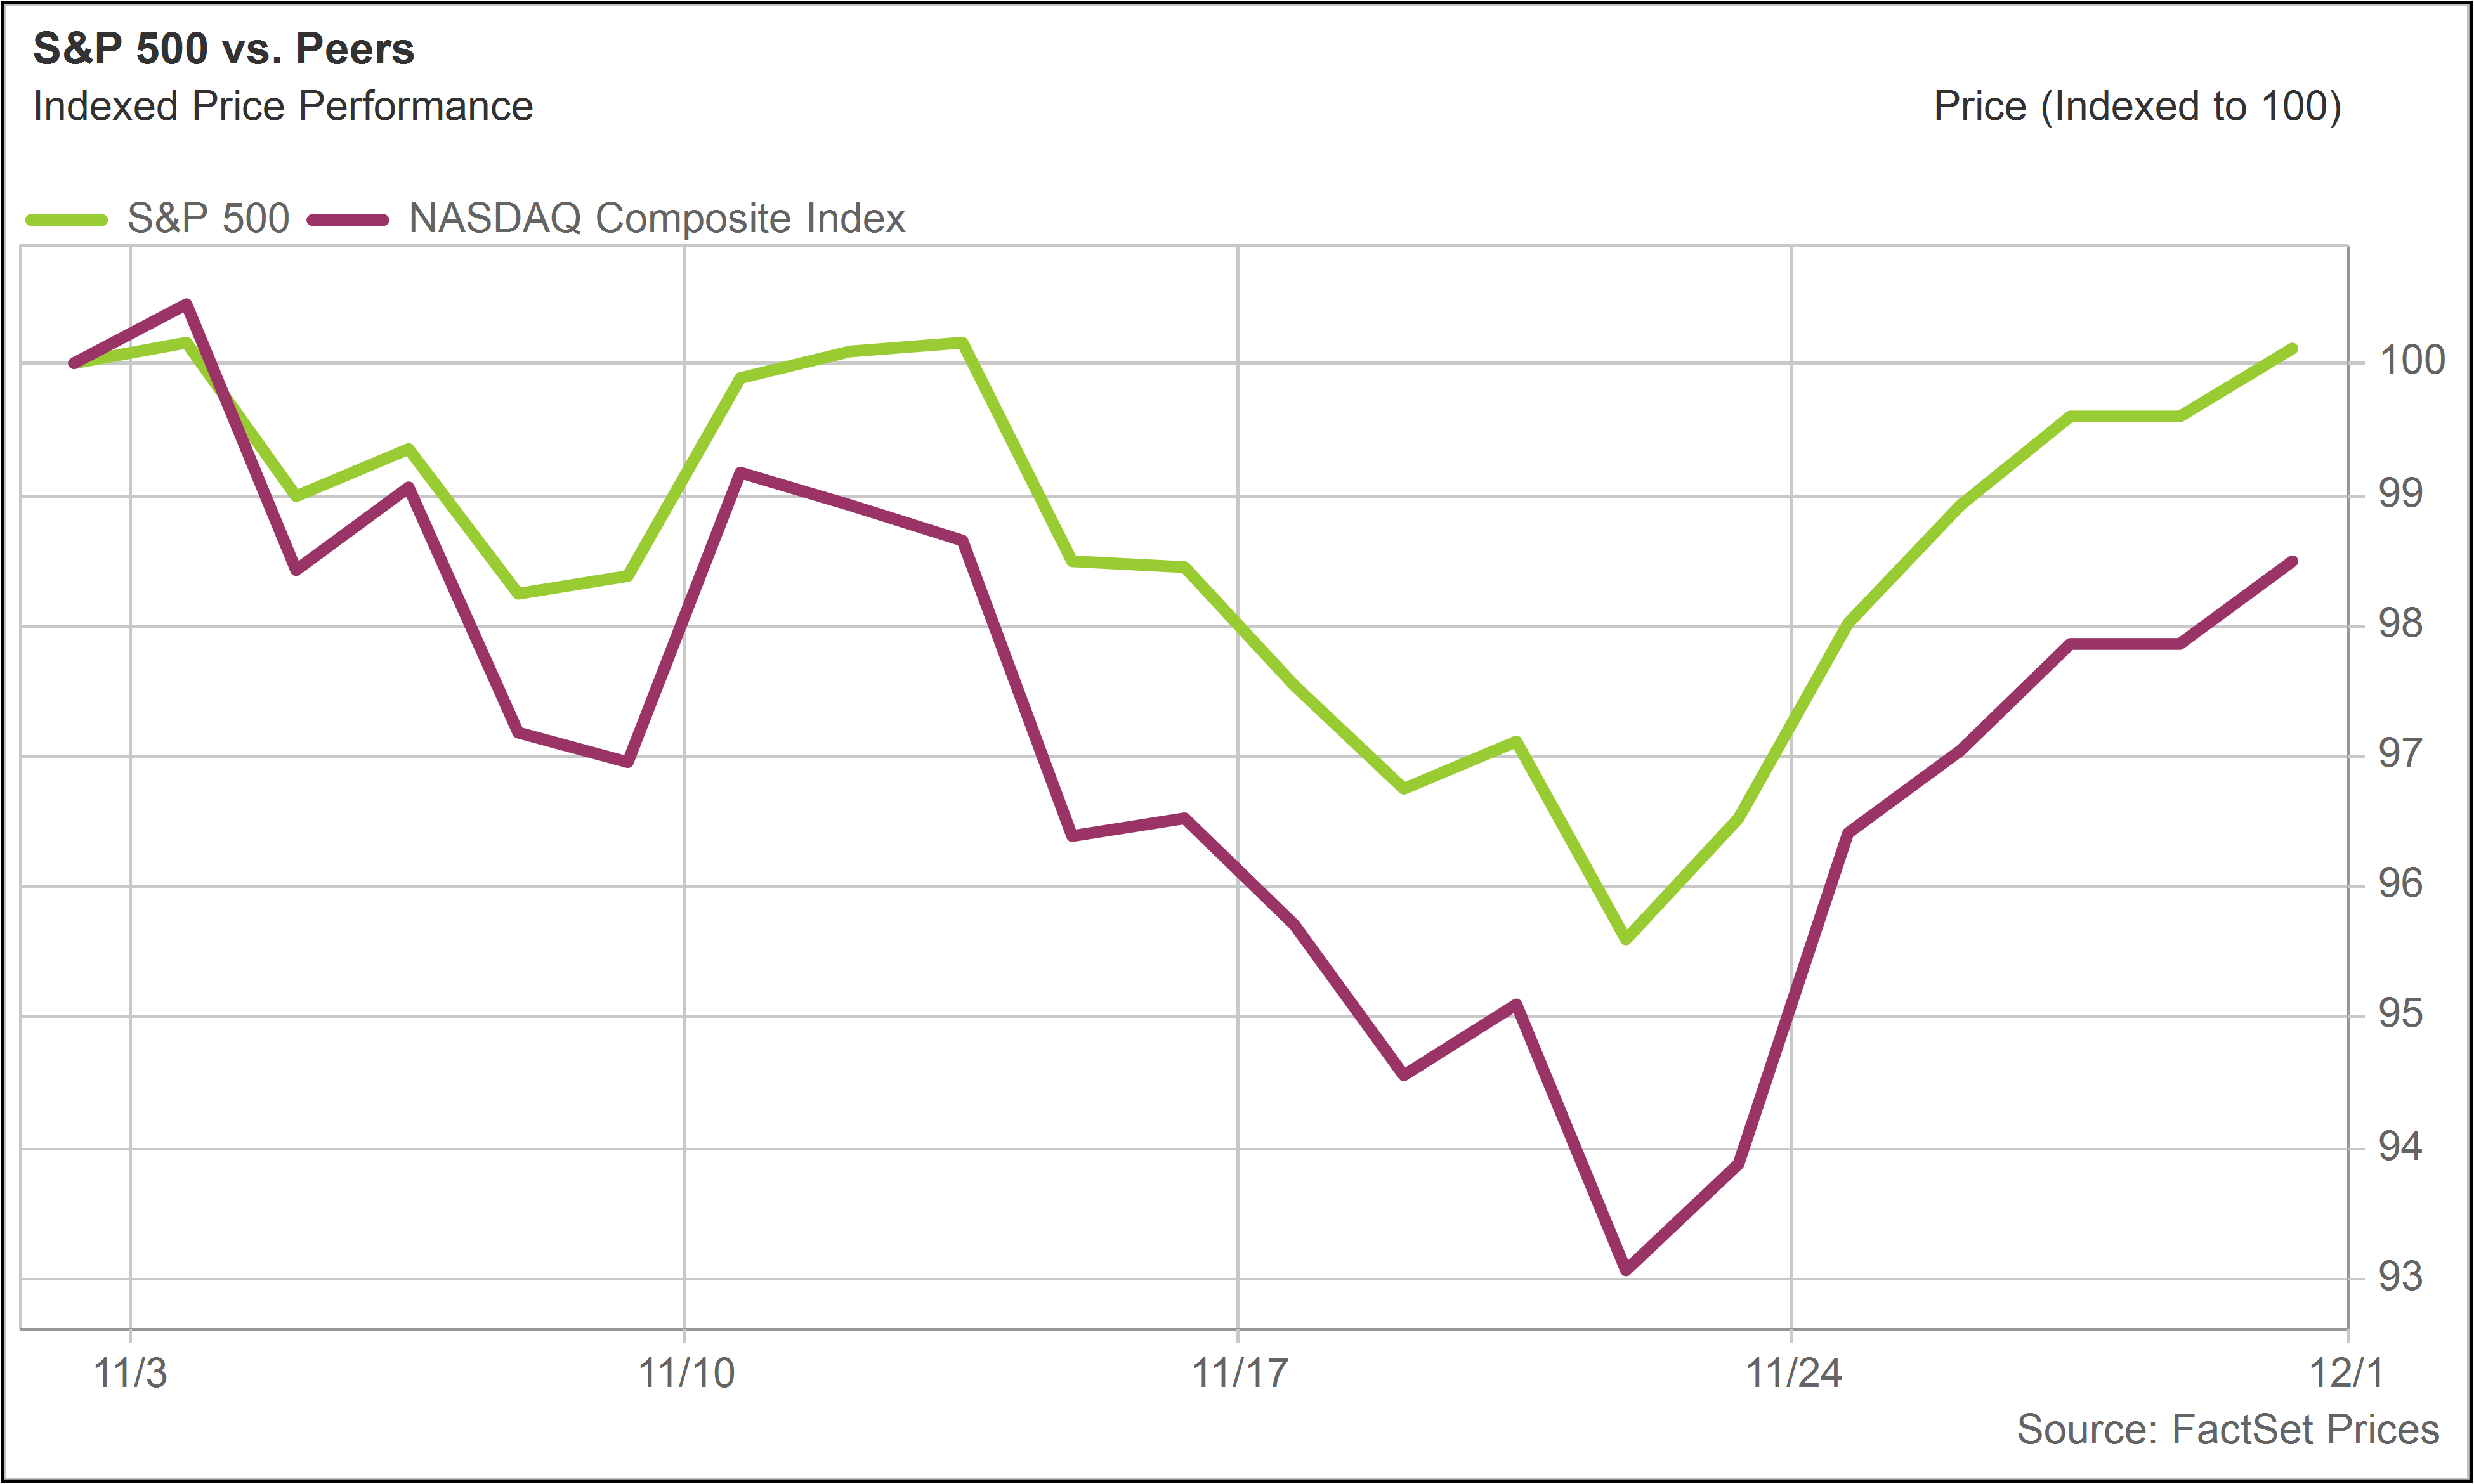
The S&P 500 actually peaked at the very end of October, just prior to the most recent Fed meeting. Although the Fed cut rates another quarter point at that meeting, Fed Chair Jerome Powell made one comment in particular that bothered the market—that it was “not a foregone conclusion, far from it” that we would see another rate cut in December.


Following this discouraging tidbit, several Fed officials in November made hawkish comments.

  • Boston Fed President Susan Collins, a voting member this year, said the bar for further cuts is now “relatively high” and that policymakers need more sustained evidence before easing again.

  • Atlanta Fed President Raphael Bostic argued that inflation remains the “clearer risk” and warned against stimulating the economy too aggressively.

  • St. Louis Fed President Alberto Musalem added that the Fed has “limited room” to reduce rates further without becoming overly accommodative.


  • Minneapolis Fed President Neel Kashkari revealed that he did not support the October rate cut and remains undecided about December. He is not a voter this year but is scheduled to rotate onto the Committee in 2026.


All of this hawkish rhetoric weighed on markets for the first few weeks of November, coinciding with the persistent bearish sentiment toward AI.


New York to the rescue


A turning point finally came when John Williams, the President of the New York Fed, said: “I still see room for a further adjustment in the near term to the target range for the federal-funds rate to move the stance of policy closer to the range of neutral.”


In English, he was saying interest rates are still at such a high level that they are needlessly slowing the economy down, so there is room to cut.


Williams’ comments were interpreted as signaling that all this talk of no more rate cuts had gone too far. Technically, all voting members of the Federal Open Market Committee (FOMC) have equal input, but the President of the New York Fed carries extra weight.


The FOMC has 12 voting members at any given time: seven Governors, four regional Fed Presidents who get rotated in, and the President of the New York Fed (a permanent seat). The New York Fed is also responsible for operational control of monetary policy.


In terms of how power really flows behind the scenes, Fed watchers informally refer to the troika, which consists of the Fed Chair, the Fed Vice Chair, and the New York Fed President. Collectively, they set the agenda.


So when Williams spoke, it was interpreted as Fed leadership attempting to keep market expectations for more rate cuts intact. Williams’ comments came on November 21, the day after stocks bottomed for the month, and are largely responsible for the strong finish.


Short-term rates move slightly


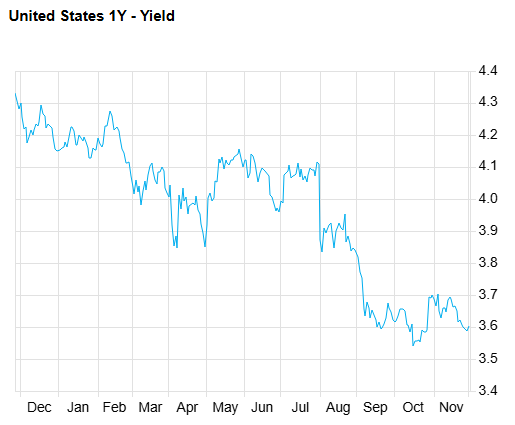
While the rhetoric around rate cuts may have been driving stock market sentiment, the impact on government bond yields was actually mild. One-year Treasuries, which reflect near-term rate cut expectations, approached 3.7% after the Fed meeting and declined toward 3.6% by the end of November.


It is worth noting that one-year Treasury yields have generally fluctuated between 3.6% and 3.7% for the past three months, suggesting no major shift in the trajectory of anticipated rate cuts. 


One-Year Treasury Yields

(Last 12 months)


Tech lags


The Technology sector was the worst performing sector within the S&P 500 in November, declining 5%. Health Care was the best performing sector, rising 9%, far higher than any other group.


The strength in Health Care was based on a few company-specific drivers. Eli Lilly (LLY), the largest Health Care stock, now represents approximately 15% of the sector, as reflected in the Health Care Select SPDR ETF (XLV).


LLY advanced 25% in November as investors priced in higher expectations for its diabetes and weight loss drugs associated with its GLP-1 franchise. At one point, the stock crossed the $1 trillion market cap threshold.

Source: FactSet


Health Care also benefited from market rotation away from AI/tech and toward previously neglected sectors, where valuations are not as elevated.


The S&P 500 Equal Weight Index outperformed the S&P 500 in November, advancing 1.9%, as investors reallocated capital away from mega-cap tech.


While we do believe the AI theme has plenty of room to run in the long-term, this market shift reminds us that there is more to the stock market than AI… and that valuations outside of technology are by no means stretched.


The S&P 500 Equal Weight Index is a good proxy for the average stock across different sectors. It takes away the mega-cap tech skew of the market-cap weighted S&P 500.


Looking back over the past 10 years, we see that the current forward P/E multiple of the Equal Weight index is in-line with long-term averages (around 16 times). The S&P 500 is somewhat higher (22 times versus 18 times), reflecting the premium now applied to tech stocks and other stocks tied to the AI theme.


S&P 500 Equal Weight vs. S&P 500

(Forward P/E Ratio - Last 10 Years)


Reasons for optimism


Notwithstanding November’s volatility, we can still identify many good reasons for investors to stay optimistic, which we outlined last week in Seven Things Investors Can Be Thankful For.


AI may be the most powerful long-term structural trend in the market, but investors do not have to limit themselves to direct AI plays to benefit from it. The impact of AI will be felt across diverse industries, through adoption of AI systems and broad-based productivity growth.

Portfolio highlights

The top performing positions within the portfolio in November were Permian Resources (PR), which returned 15%; Diamondback Energy (FANG), which returned 7%; and Mid-America Apartments (MAA), which returned 6%.


Two positions generated negative returns. Digital Realty Trust (DLR) returned -6%, and VICI Properties (VICI) returned -4%.


PR, an independent oil and gas producer, delivered another strong quarter, reinforcing why it remains one of the most efficient operators in the Permian Basin. The company once again posted a production beat, with total output coming in above expectations, while still keeping capital spending unchanged.


PR continues to drive costs lower, with drilling and completion expenses falling below its 2025 guidance—a rare feat in today’s inflationary service market.


New pipeline agreements are reducing its exposure to depressed West Texas pricing. These deals are expected to generate over $100 million in incremental free cash flow next year, with further improvement expected in 2027.


While the company performs well operationally, the stock’s valuation also remains attractive, with double-digit free cash flow yields.


FANG likewise performed well in November after reporting another strong quarter that reinforced its position as one of the most efficient operators in the Permian Basin. The company continues to benefit from a deep, low-cost inventory and exceptional well productivity.


Capital discipline remains a key differentiator: FANG is committed to returning the majority of free cash flow to shareholders while maintaining a clean balance sheet and tight operational control. The stock remains well positioned to outperform to the extent oil prices remain supportive or investor sentiment toward the energy sector improves.


MAA advanced as investors grew more confident that the worst of the Sunbelt supply glut is starting to pass. In recent meetings, management noted stabilizing occupancy and consistent leasing traffic across the portfolio.


Although new supply remains elevated in certain markets, deliveries are already running at 40–50% below long-term averages and are expected to fall another 30–40% next year, setting up a much healthier backdrop for rent growth.


In-migration to MAA’s markets continues, rent-to-income ratios are still below historical averages, and renewal offers in the 4.5–5% range are seeing little pushback from residents.


As a reminder, we revisited MAA last month in How to Play the Zohran Exodus.


DLR, a leading data center REIT, retreated, likely in sympathy with the pullback in stocks tied to the AI infrastructure buildout.


At the end of October, DLR delivered solid third quarter results supported by a diversified demand backdrop. The company’s sizable leasing backlog and the timing of scheduled lease commencements give DLR strong visibility into continued growth through 2026 and beyond.


With sustained pricing tailwinds and durable hyperscale demand, DLR remains well positioned despite fluctuations in AI sentiment.


Shares of VICI, a “net-lease” REIT that owns experiential real estate under long-term leases, declined modestly in the absence of meaningful catalysts.


VICI maintains strong tenant coverage ratios and predictable cash flows. We view its recent softness as a function of macro rate dynamics rather than any deterioration in fundamentals.

Key metrics

Valuation detail

Performance detail

Company snapshots

Blackstone (BX)

Digital Realty Trust (DLR)

Texas Instruments (TXN)

VICI Properties (VICI)

Williams (WMB)

Crown Castle (CCI)

Carlyle Group (CG)

Diamondback Energy (FANG)

Kinder Morgan (KMI)

Mid-America Apartment (MAA)

Prologis (PLD)

Permian Resources (PR)

Sempra (SRE)

Strategy 8% Perpetual Pref (STRK)

WEC Energy Group (WEC)

The 76research Income Builder Model Portfolio is intended for income-oriented investors and managed to generate an overall yield that is materially higher than broad equity indices. The portfolio includes stocks with above average dividend yields from a cross section of industries. While investments are screened for their income and income growth characteristics, specific holdings are chosen based on valuation and general business quality, growth and risk considerations.

FOR SUBSCRIBER USE ONLY. DO NOT FORWARD OR SHARE.