American Resilience
*|MC:SUBJECT|*
͏ ‌     ͏ ‌     ͏ ‌     ͏ ‌     ͏ ‌     ͏ ‌     ͏ ‌     ͏ ‌     ͏ ‌     ͏ ‌     ͏ ‌     ͏ ‌     ͏ ‌     ͏ ‌     ͏ ‌     ͏ ‌     ͏ ‌     ͏ ‌     ͏ ‌     ͏ ‌     ͏ ‌     ͏ ‌     ͏ ‌     ͏ ‌     ͏ ‌     ͏ ‌     ͏ ‌     ͏ ‌     ͏ ‌     ͏ ‌     ͏ ‌     ͏ ‌     ͏ ‌     ͏ ‌     ͏ ‌     ͏ ‌     ͏ ‌     ͏ ‌     ͏ ‌     ͏ ‌     ͏ ‌     ͏ ‌     ͏ ‌     ͏ ‌     ͏ ‌     ͏ ‌     ͏ ‌     ͏ ‌     ͏ ‌     ͏ ‌     ͏ ‌     ͏ ‌     ͏ ‌     ͏ ‌     ͏ ‌     ͏ ‌     ͏ ‌     ͏ ‌     ͏ ‌     ͏ ‌     ͏ ‌     ͏ ‌     ͏ ‌     ͏ ‌     ͏ ‌     ͏ ‌     ͏ ‌     ͏ ‌     ͏ ‌     ͏ ‌     ͏ ‌     ͏ ‌     ͏ ‌     ͏ ‌     ͏ ‌     ͏ ‌     ͏ ‌     ͏ ‌     ͏ ‌     ͏ ‌     ͏ ‌     ͏ ‌     ͏ ‌     ͏ ‌     ͏ ‌     ͏ ‌     ͏ ‌     ͏ ‌     ͏ ‌     ͏ ‌     ͏ ‌     ͏ ‌     ͏ ‌     ͏ ‌     ͏ ‌     ͏ ‌     ͏ ‌     ͏ ‌     ͏ ‌     ͏ ‌     ͏ ‌     ͏ ‌     ͏ ‌     ͏ ‌     ͏ ‌     ͏ ‌     ͏ ‌     ͏ ‌     ͏ ‌     ͏ ‌     ͏ ‌     ͏ ‌     ͏ ‌     ͏ ‌     ͏ ‌     ͏ ‌     ͏ ‌     ͏ ‌     ͏ ‌     ͏ ‌     ͏ ‌     ͏ ‌     ͏ ‌     ͏ ‌     ͏ ‌     ͏ ‌     ͏ ‌     ͏ ‌     ͏ ‌     ͏ ‌     ͏ ‌     ͏ ‌     ͏ ‌     ͏ ‌     ͏ ‌     ͏ ‌     ͏ ‌     ͏ ‌     ͏ ‌     ͏ ‌     ͏ ‌     ͏ ‌     ͏ ‌     ͏ ‌     ͏ ‌     ͏ ‌     ͏ ‌     ͏ ‌     ͏ ‌     ͏ ‌     ͏ ‌     ͏ ‌     ͏ ‌     ͏ ‌     ͏ ‌     ͏ ‌     ͏ ‌     ͏ ‌     ͏ ‌     ͏ ‌     ͏ ‌     ͏ ‌     ͏ ‌     ͏ ‌     ͏ ‌     ͏ ‌     ͏ ‌     ͏ ‌     ͏ ‌     ͏ ‌     ͏ ‌     ͏ ‌     ͏ ‌     ͏ ‌     ͏ ‌     ͏ ‌     ͏ ‌     ͏ ‌     ͏ ‌     ͏ ‌     ͏ ‌     ͏ ‌     ͏ ‌     ͏ ‌     ͏ ‌     ͏ ‌     ͏ ‌     ͏ ‌     ͏ ‌     ͏ ‌     ͏ ‌     ͏ ‌     ͏ ‌     ͏ ‌     ͏ ‌     ͏ ‌     ͏ ‌     ͏ ‌     ͏ ‌     ͏ ‌     ͏ ‌     ͏ ‌     ͏ ‌     ͏ ‌     ͏ ‌     ͏ ‌     ͏ ‌     ͏ ‌     ͏ ‌     ͏ ‌     ͏ ‌     ͏ ‌     ͏ ‌     ͏ ‌     ͏ ‌     ͏ ‌     ͏ ‌     ͏ ‌     ͏ ‌     ͏ ‌     ͏ ‌     ͏ ‌     ͏ ‌     ͏ ‌     ͏ ‌     ͏ ‌     ͏ ‌     ͏ ‌     ͏ ‌     ͏ ‌     ͏ ‌     ͏ ‌     ͏ ‌     ͏ ‌     ͏ ‌     ͏ ‌     ͏ ‌     ͏ ‌     ͏ ‌     ͏ ‌     ͏ ‌     ͏ ‌     ͏ ‌     ͏ ‌     ͏ ‌     ͏ ‌     ͏ ‌     ͏ ‌     ͏ ‌     ͏ ‌     ͏ ‌     ͏ ‌     ͏ ‌     ͏ ‌     ͏ ‌     ͏ ‌     ͏ ‌     ͏ ‌     ͏ ‌     ͏ ‌     ͏ ‌     ͏ ‌     ͏ ‌     ͏ ‌     ͏ ‌     ͏ ‌     ͏ ‌     ͏ ‌     ͏ ‌     ͏ ‌     ͏ ‌     ͏ ‌     ͏ ‌     ͏ ‌     ͏ ‌     ͏ ‌     ͏ ‌     ͏ ‌     ͏ ‌     ͏ ‌     ͏ ‌     ͏ ‌     ͏ ‌     ͏ ‌     ͏ ‌     ͏ ‌     ͏ ‌     ͏ ‌     ͏ ‌     ͏ ‌     ͏ ‌     ͏ ‌     ͏ ‌     ͏ ‌     ͏ ‌     ͏ ‌     ͏ ‌     ͏ ‌     ͏ ‌     ͏ ‌     ͏ ‌     ͏ ‌     ͏ ‌     ͏ ‌     ͏ ‌     ͏ ‌     ͏ ‌     ͏ ‌     ͏ ‌     ͏ ‌     ͏ ‌     ͏ ‌     ͏ ‌     ͏ ‌     ͏ ‌     ͏ ‌     ͏ ‌     ͏ ‌     ͏ ‌     ͏ ‌    ­ ­ ­ ­ ­ ­ ­ ­ ­ ­ ­ ­ ­ ­ ­ ­ ­ ­ ­ ­ ­ ­ ­ ­ ­ ­ ­ ­ ­ ­ ­ ­ ­ ­ ­ ­ ­ ­ ­ ­ ­ ­ ­ ­ ­ ­ ­ ­ ­ ­ ­ ­ ­ ­ ­ ­ ­ ­ ­ ­ ­ ­ ­ ­ ­ ­ ­ ­ ­ ­ ­ ­ ­ ­ ­ ­ ­ ­ ­ ­ ­ ­ ­ ­ ­ ­ ­ ­ ­ ­ ­ ­ ­ ­ ­ ­ ­ ­ ­ ­ ­ ­ ­ ­ ­ ­ ­ ­ ­ ­ ­ ­ ­ ­ ­ ­ ­ ­ ­ ­ ­ ­ ­ ­ ­ ­ ­ ­ ­ ­ ­ ­ ­ ­ ­ ­ ­ ­ ­ ­ ­ ­ ­ ­ ­ ­ ­ ­ ­ ­ ­ ­ ­ ­ ­ ­ ­ ­ ­ ­ ­ ­ ­ ­ ­ ­ ­ ­ ­ ­ ­ ­ ­ ­ ­ ­ ­ ­ ­ ­ ­ ­ ­ ­ ­ ­ ­ ­ ­ ­ ­ ­ ­ ­ ­ ­ ­ ­ ­ ­ ­ ­ ­ ­ ­ ­ ­ ­ ­ ­ ­ ­ ­ ­ ­ ­ ­ ­ ­ ­ ­ ­ ­ ­ ­ ­ ­ ­ ­ ­ ­ ­ ­ ­ ­ ­ ­ ­ ­ ­ ­ ­ ­ ­ ­ ­ ­ ­ ­ ­ ­ ­ ­ ­ ­ ­ ­ ­ ­ ­ ­ ­ ­ ­ ­ ­ ­ ­ ­ ­ ­ ­ ­ ­ ­ ­ ­ ­ ­ ­ ­ ­

American Resilience Model Portfolio

Monthly Portfolio Review: November 2025

Publication date: December 2, 2025

Current portfolio holdings

FOR SUBSCRIBER USE ONLY. DO NOT FORWARD OR SHARE.

Executive summary

  • Stocks were more or less flat in November, despite sharp mid-month declines.

  • After months of outperformance, Tech stocks lagged. The tech-heavy Nasdaq Composite declined 1.5%, versus a 0.3% return for the S&P 500.

  • Sentiment toward the AI theme dipped as investors rotated into underperforming sectors. Concerns about the trajectory of future rate cuts also influenced markets.

  • The American Resilience portfolio returned -1.2% in November, affected mainly by tech holdings Oracle (ORCL) and NVIDIA (NVDA).

  • We view the recent downturn in ORCL as substantially overdone given the perceived risks to its growth potential and valuation impact.

  • Outside of tech, the portfolio benefited from strong earnings results from Arch Capital (ACGL), Air Products & Chemicals (APD), and Williams (WMB).

  • Notwithstanding recent volatility, we are optimistic about the outlook for the portfolio’s holdings, both within and beyond the AI theme.

Performance review

The American Resilience portfolio produced a total return of -1.2% in November, versus the S&P 500 Index return of 0.3%. On a year to date basis through the end of the month, the portfolio has returned 10.8%, versus 17.8% for the S&P 500.


The top performing portfolio positions in November were Arch Capital Group (ACGL), which returned 9%; Air Products & Chemicals (APD), which returned 8%; and Williams (WMB), which returned 5%.


The worst performing positions in the portfolio were Oracle (ORCL), which declined 23%; NVIDIA (NVDA), which declined 13%; and GXO Logistics (GXO), which declined 10%.

A volatile month


While the S&P 500 did slightly advance in November, it was a highly volatile month, marked by sharp declines in tech stocks, especially those related to the AI-buildout theme. The tech-heavy Nasdaq Composite Index underperformed the S&P 500 and returned -1.5% this month.


While the month ended up more or less flat, performance was in fact much worse toward the middle of the month. At their lowest levels on November 20, the S&P 500 and the Nasdaq were down 4.4% and 6.9% respectively from the end of October.

S&P 500 and NASDAQ Composite

Total Return (10/31/25 - 11/30/25)


“AI jitters”


We noted last month that it was possible that fiscal year-end window dressing contributed to the sharp tech outperformance we saw in October. Most stock funds end their fiscal years on October 31.


The idea was that fund managers were scrambling to add top performers (especially AI winners) to their portfolios by the end of the month. To the extent that happened, it raises the possibility that this non-fundamental demand driver disappeared in November.


It is sometimes hard to read what exactly drives market movements. This month was arguably more difficult than others.


Often, there are clear market events that we can point to, such as the Liberation Day tariff announcements that sent stocks reeling in early April. In November, there was not an obvious or direct explanation for the tech-led mid-month sell-off.


Many financial media headlines made reference to “AI jitters”—in other words, the market reconsidering the sustainability of the AI infrastructure boom.


But even after NVIDIA (NVDA) reported genuinely strong earnings results on November 19, which initially lifted markets, the selling pressure continued, at least for another day, before seeming to exhaust itself.


The AI bubble debate resurfaced in November. This could have been either a cause or a result of the decline in tech stocks… or a little of both.


In other words, were investors selling stocks because they feared an AI bubble? Or were they talking about an AI bubble simply because tech stocks were correcting after several months of strong outperformance?


What matters ultimately is how these companies perform in the years ahead, not what the market mood meter read at some point along the way. Investors should always anchor to long-term expectations for profitability.


Are rate cuts done?


Alongside AI-related anxiety, the market became preoccupied in November with statements from various Federal Reserve officials. Ever since the Jackson Hole meeting in August, investors have been counting on a trajectory of incremental rate cuts. But in November, doubts surfaced.


The S&P 500 actually peaked at the very end of October, just prior to the most recent Fed meeting. Although the Fed cut rates another quarter point at that meeting, Fed Chair Jerome Powell made one comment in particular that bothered the market—that it was “not a foregone conclusion, far from it” that we would see another rate cut in December.


Following this discouraging tidbit, several Fed officials in November made hawkish comments.

  • Boston Fed President Susan Collins, a voting member this year, said the bar for further cuts is now “relatively high” and that policymakers need more sustained evidence before easing again.

  • Atlanta Fed President Raphael Bostic argued that inflation remains the “clearer risk” and warned against stimulating the economy too aggressively.

  • St. Louis Fed President Alberto Musalem added that the Fed has “limited room” to reduce rates further without becoming overly accommodative.


  • Minneapolis Fed President Neel Kashkari revealed that he did not support the October rate cut and remains undecided about December. He is not a voter this year but is scheduled to rotate onto the Committee in 2026.


All of this hawkish rhetoric weighed on markets for the first few weeks of November, coinciding with the persistent bearish sentiment toward AI.


New York to the rescue


A turning point finally came when John Williams, the President of the New York Fed, said: “I still see room for a further adjustment in the near term to the target range for the federal-funds rate to move the stance of policy closer to the range of neutral.”


In English, he was saying interest rates are still at such a high level that they are needlessly slowing the economy down, so there is room to cut.


Williams’ comments were interpreted as signaling that all this talk of no more rate cuts had gone too far. Technically, all voting members of the Federal Open Market Committee (FOMC) have equal input, but the President of the New York Fed carries extra weight.


The FOMC has 12 voting members at any given time: seven Governors, four regional Fed Presidents who get rotated in, and the President of the New York Fed (a permanent seat). The New York Fed is also responsible for operational control of monetary policy.


In terms of how power really flows behind the scenes, Fed watchers informally refer to the troika, which consists of the Fed Chair, the Fed Vice Chair, and the New York Fed President. Collectively, they set the agenda.


So when Williams spoke, it was interpreted as Fed leadership attempting to keep market expectations for more rate cuts intact. Williams’ comments came on November 21, the day after stocks bottomed for the month, and are largely responsible for the strong finish.


Short-term rates move slightly


While the rhetoric around rate cuts may have been driving stock market sentiment, the impact on government bond yields was actually mild. One-year Treasuries, which reflect near-term rate cut expectations, approached 3.7% after the Fed meeting and declined toward 3.6% by the end of November.


It is worth noting that one-year Treasury yields have generally fluctuated between 3.6% and 3.7% for the past three months, suggesting no major shift in the trajectory of anticipated rate cuts. 

One-Year Treasury Yields

(Last 12 months)

Tech lags


The Technology sector was the worst performing sector within the S&P 500 in November, declining 5%. Health Care was the best performing sector, rising 9%, far higher than any other group.


The strength in Health Care was based on a few company-specific drivers. Eli Lilly (LLY), the largest Health Care stock, now represents approximately 15% of the sector, as reflected in the Health Care Select SPDR ETF (XLV).


LLY advanced 25% in November as investors priced in higher expectations for its diabetes and weight loss drugs associated with its GLP-1 franchise. At one point, the stock crossed the $1 trillion market cap threshold.

Source: FactSet

Health Care also benefited from market rotation away from AI/tech and toward previously neglected sectors, where valuations are not so elevated.


The S&P 500 Equal Weight Index outperformed the S&P 500 in November, advancing 1.9%, as investors reallocated capital away from mega-cap tech.


While we do believe the AI theme has plenty of room to run in the long-term, this market shift reminds us that there is more to the stock market than AI… and that valuations outside of technology are by no means stretched.


The S&P 500 Equal Weight Index is a good proxy for the average stock across different sectors. It takes away the mega-cap tech skew of the market-cap weighted S&P 500.


Looking back over the past 10 years, we see that the current forward P/E multiple of the Equal Weight index is in-line with long-term averages (around 16 times). The S&P 500 is somewhat higher (22 times versus 18 times), reflecting the premium now applied to tech stocks and other stocks tied to the AI theme.

S&P 500 Equal Weight vs. S&P 500

(Forward P/E Ratio - Last 10 Years)

Reasons for optimism


Notwithstanding November’s volatility, we can still identify many good reasons for investors to stay optimistic, which we outlined last week in Seven Things Investors Can Be Thankful For.


AI may be the most powerful long-term structural trend in the market, but investors do not have to limit themselves to direct AI plays to benefit from it. The impact of AI will be felt across diverse industries, through adoption of AI systems and broad-based productivity growth.

Portfolio highlights


The top performing stocks in the portfolio in November were Arch Capital Group (ACGL), which returned 9%; Air Products & Chemicals (APD), which returned 8%; and Williams (WMB), which returned 6%.


The worst performers in the portfolio this month were Oracle (ORCL), which returned -23%; NVIDIA (NVDA), which returned -13%; and GXO Logistics (GXO), which returned -9%.

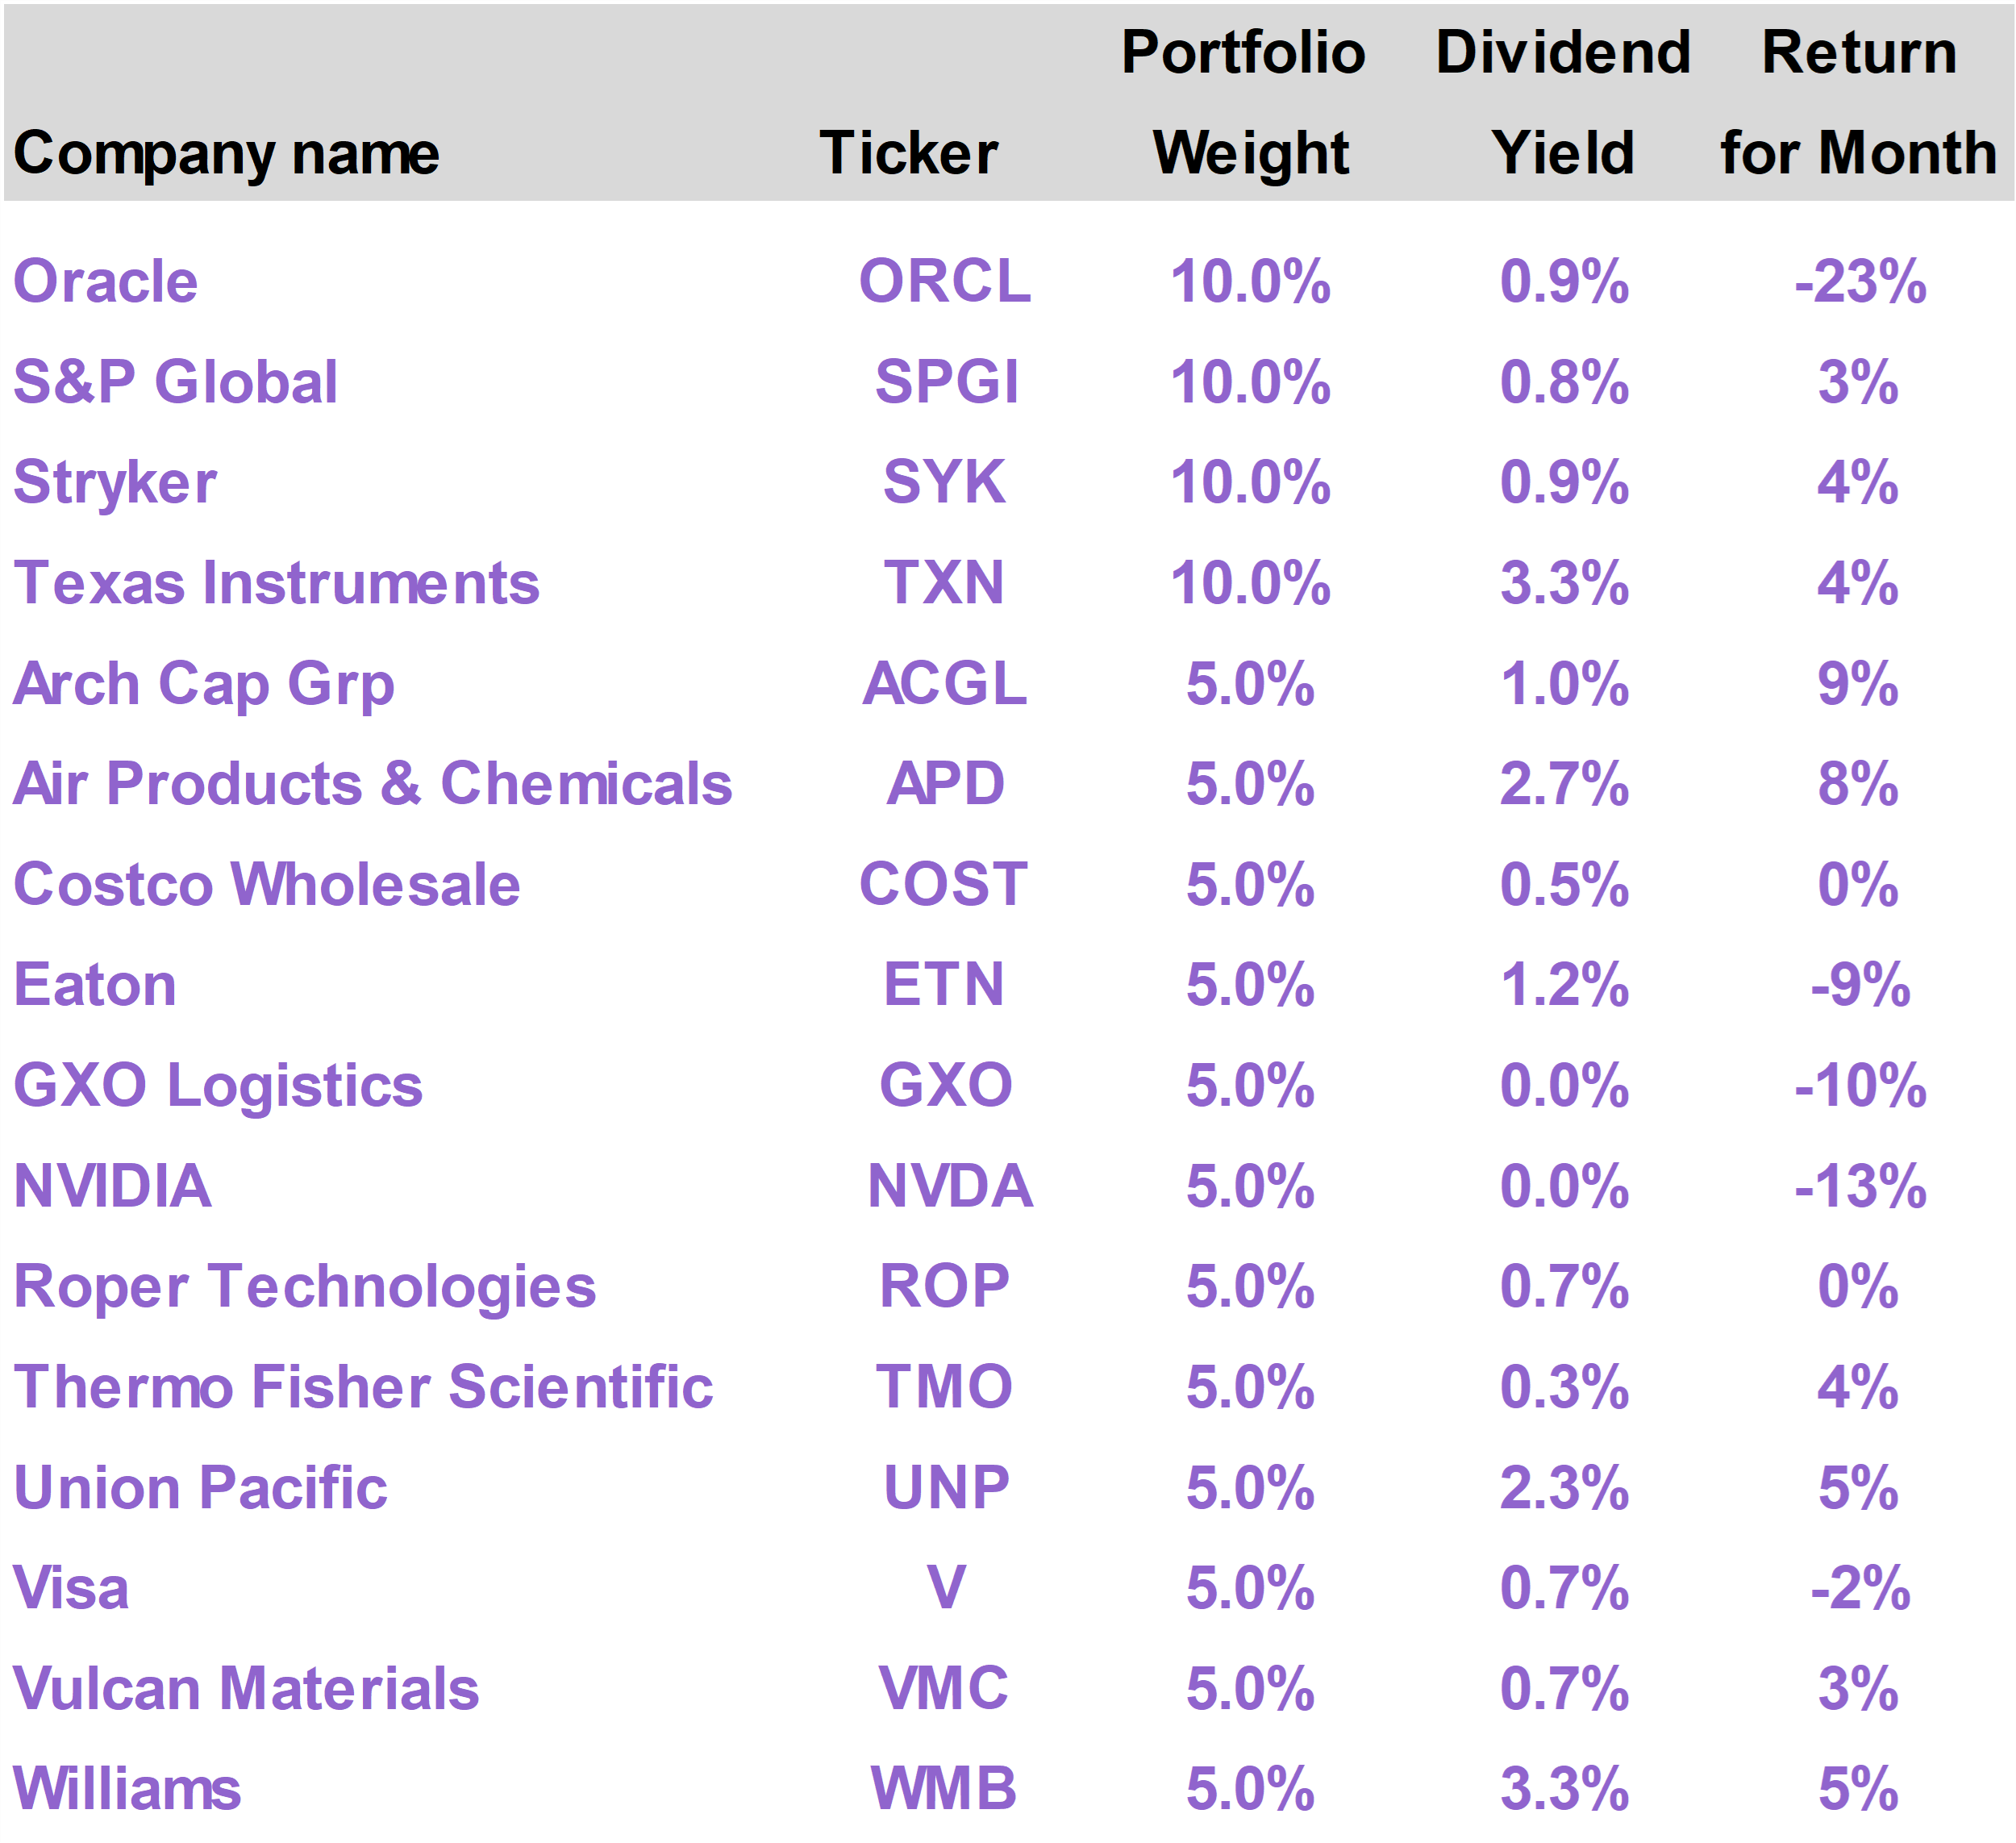
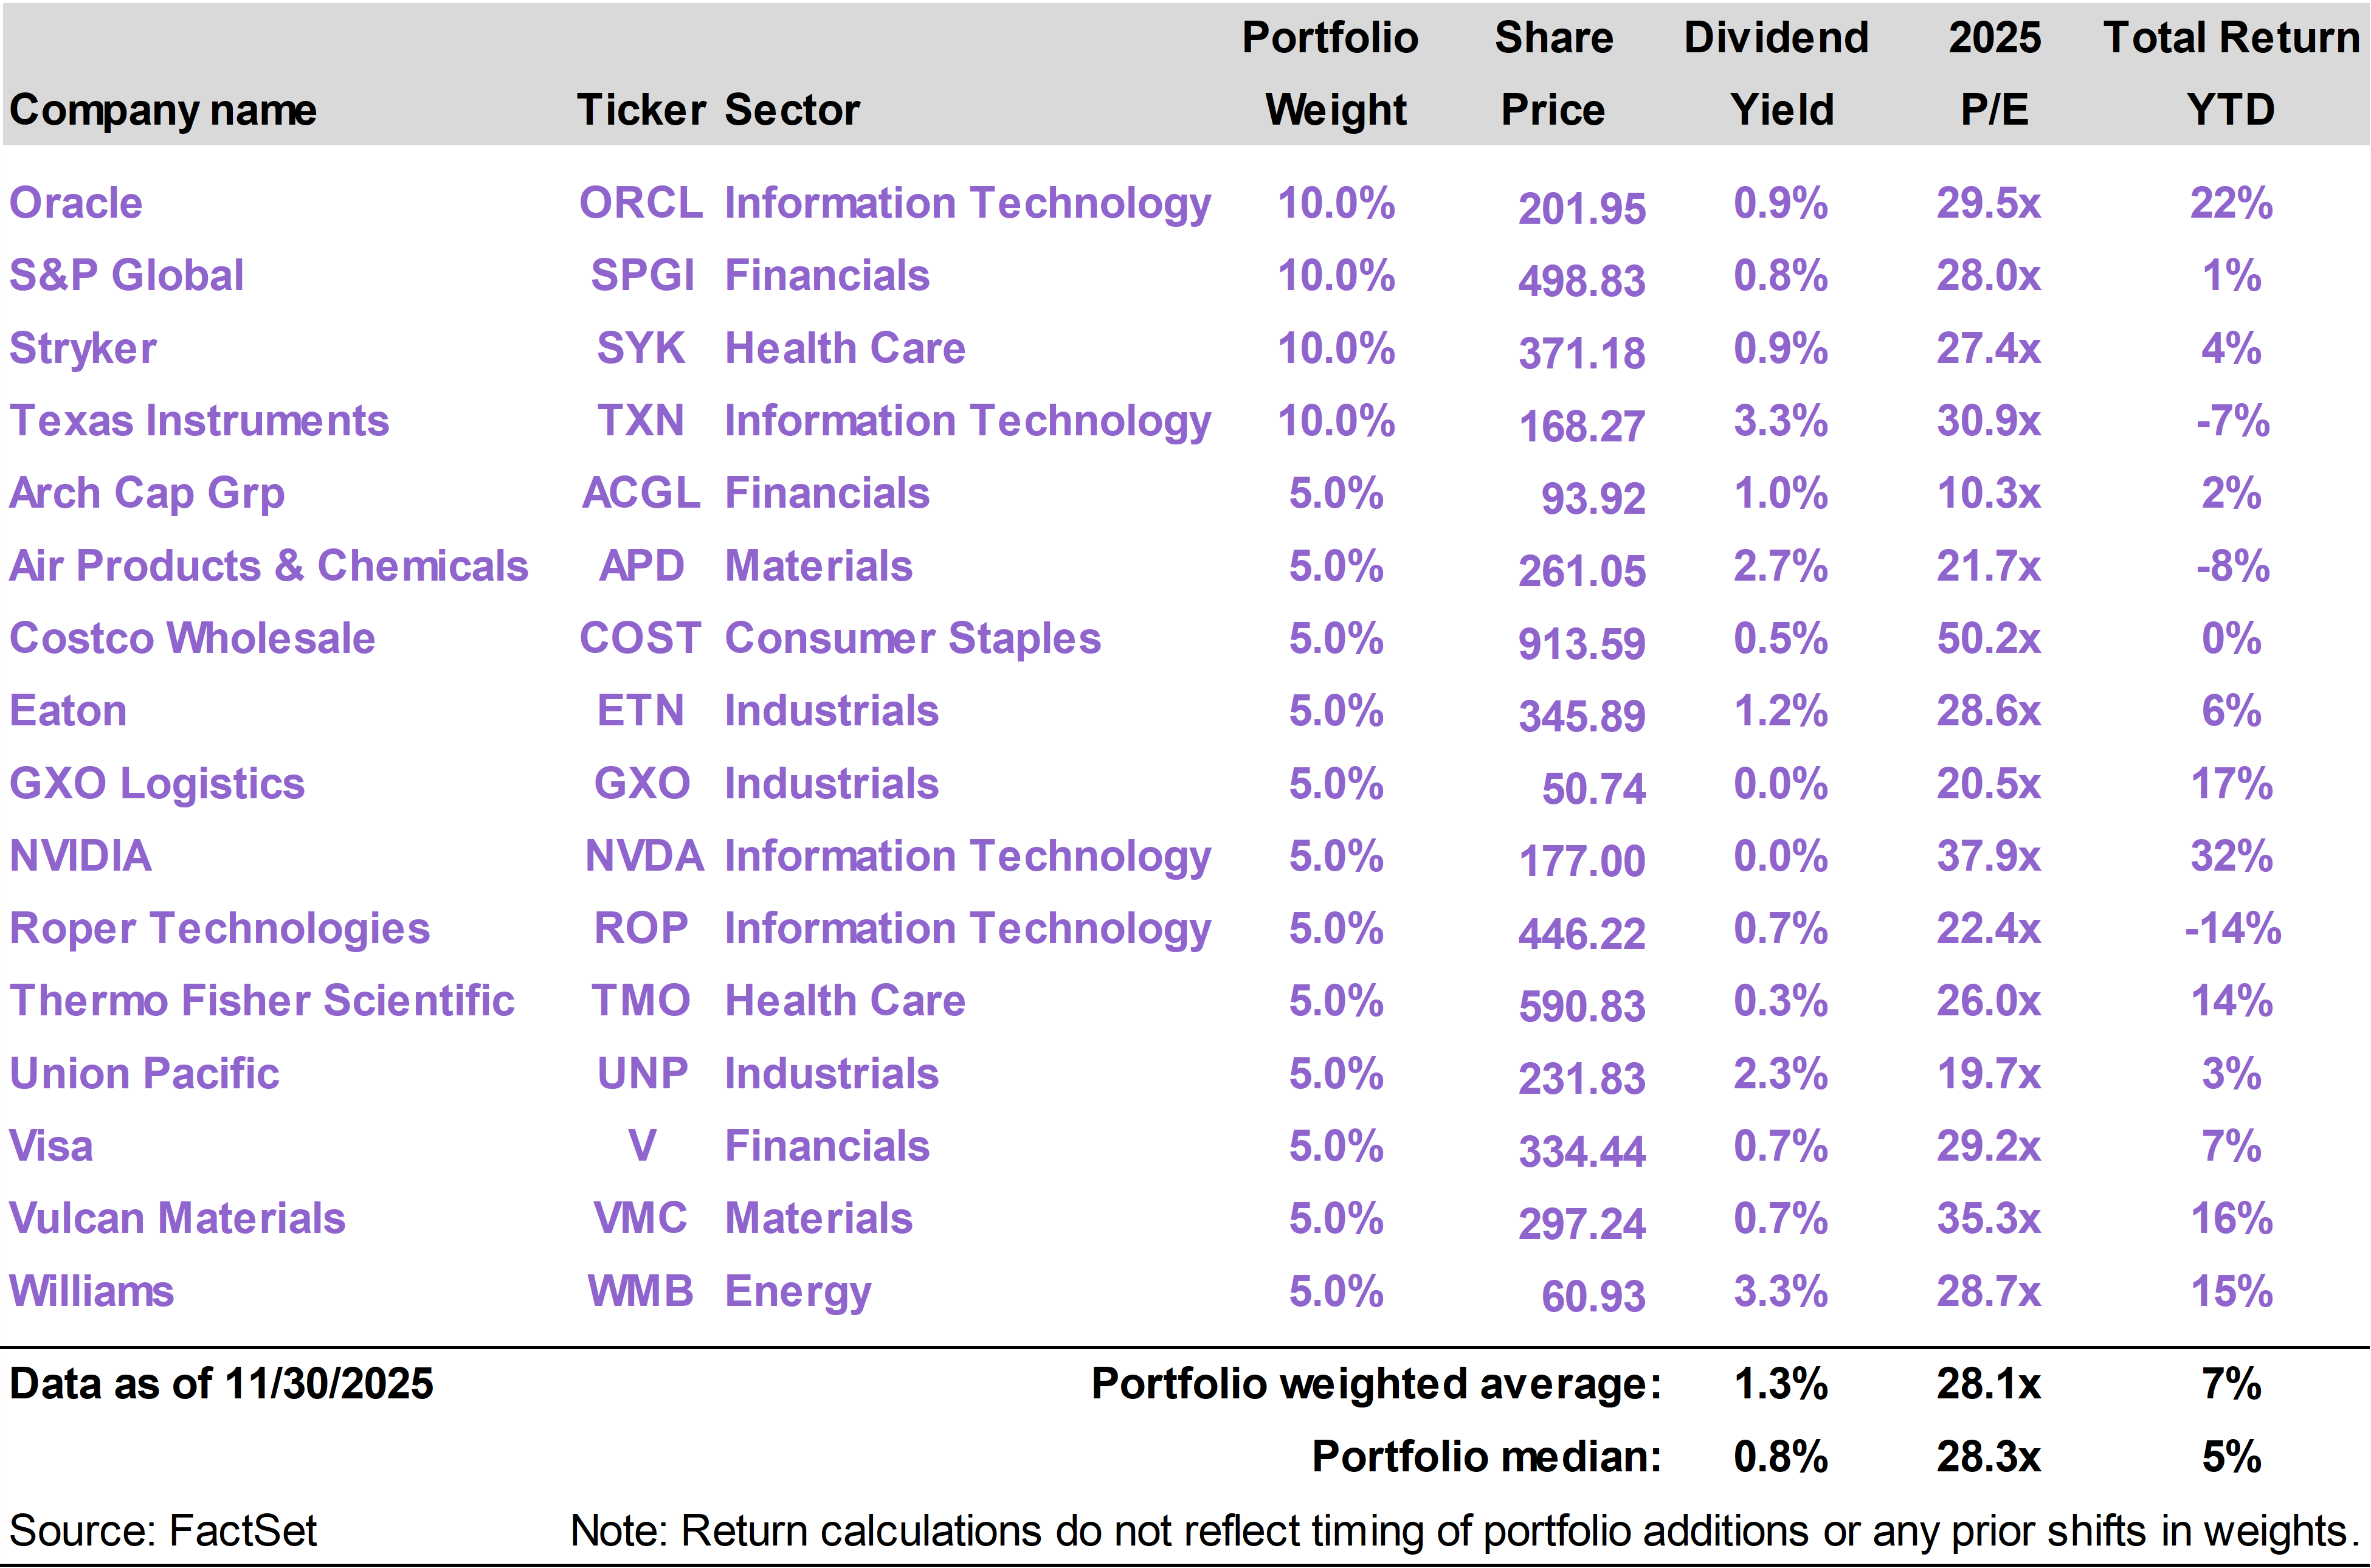
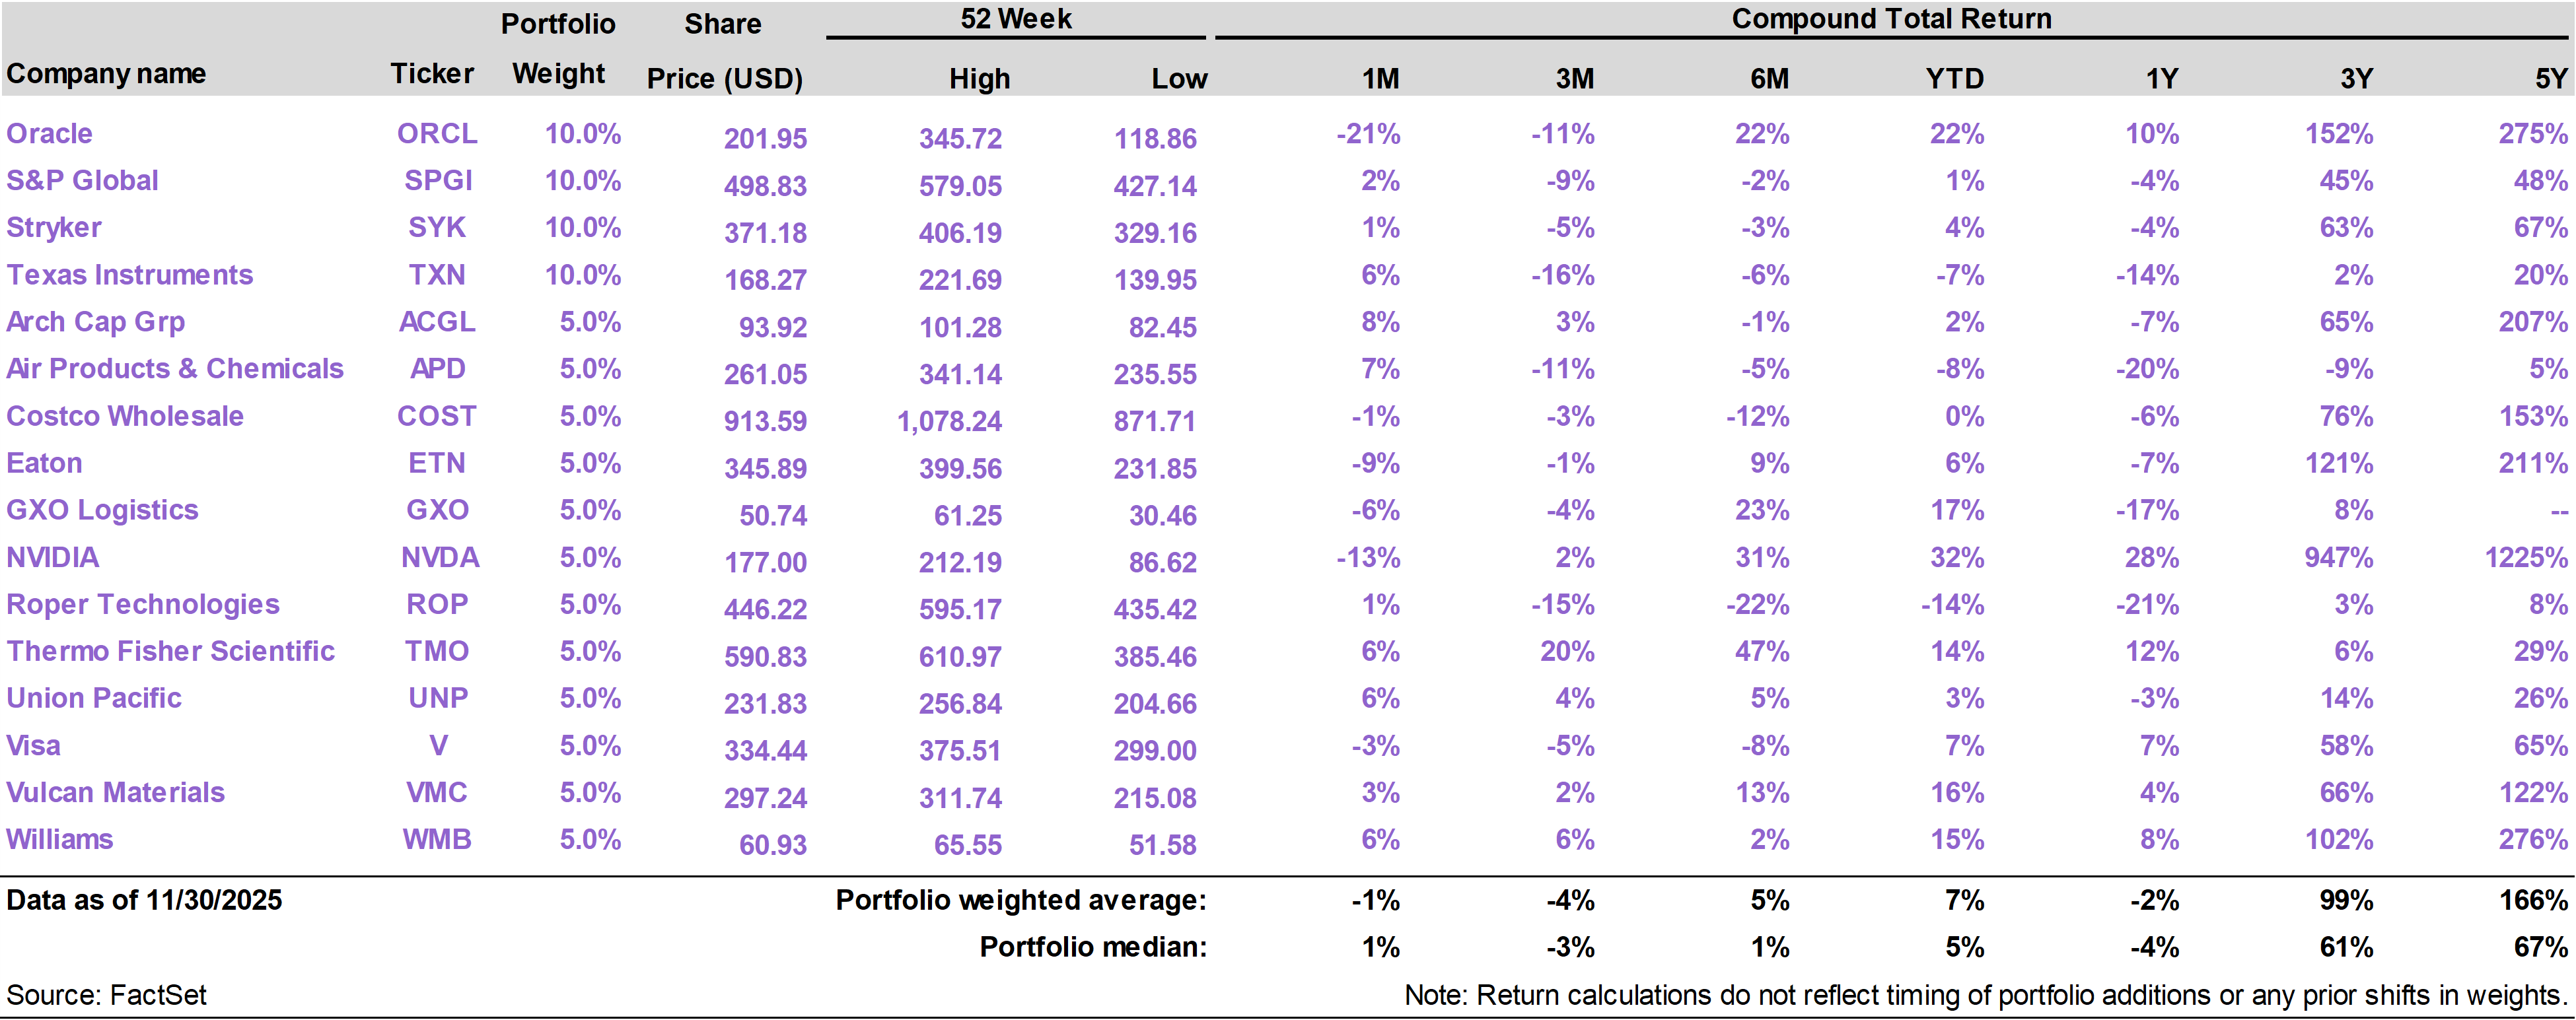
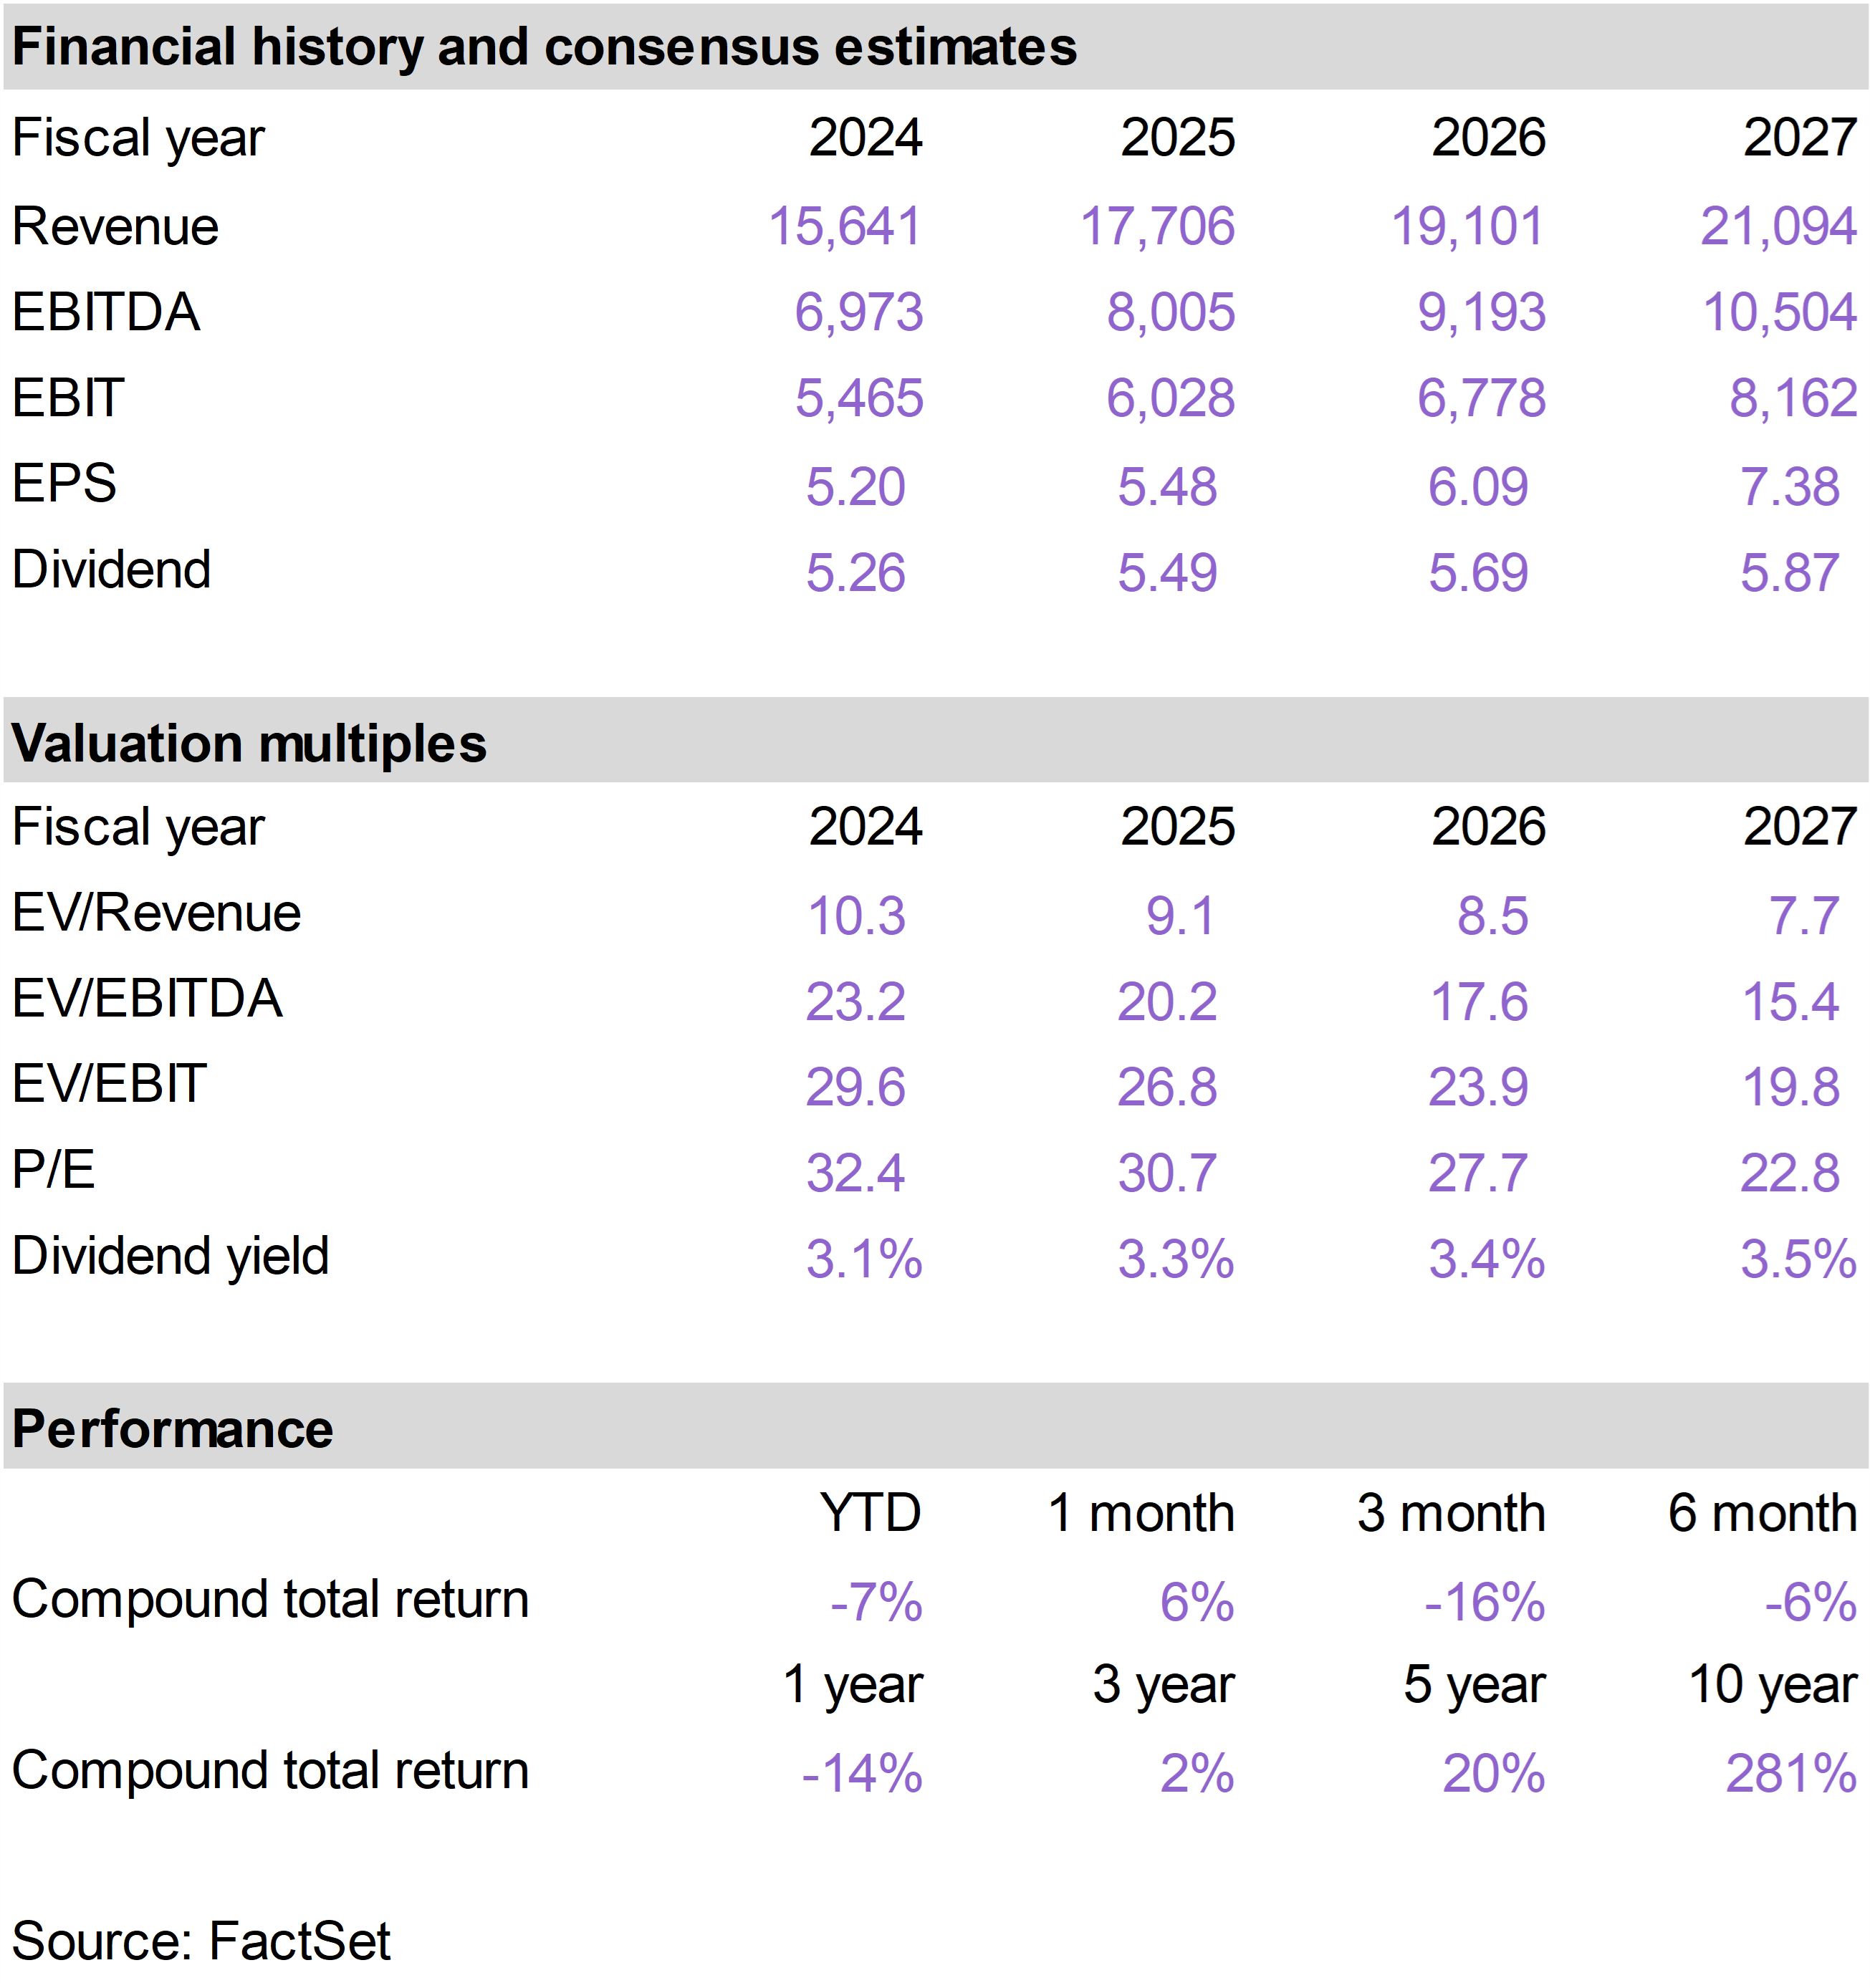
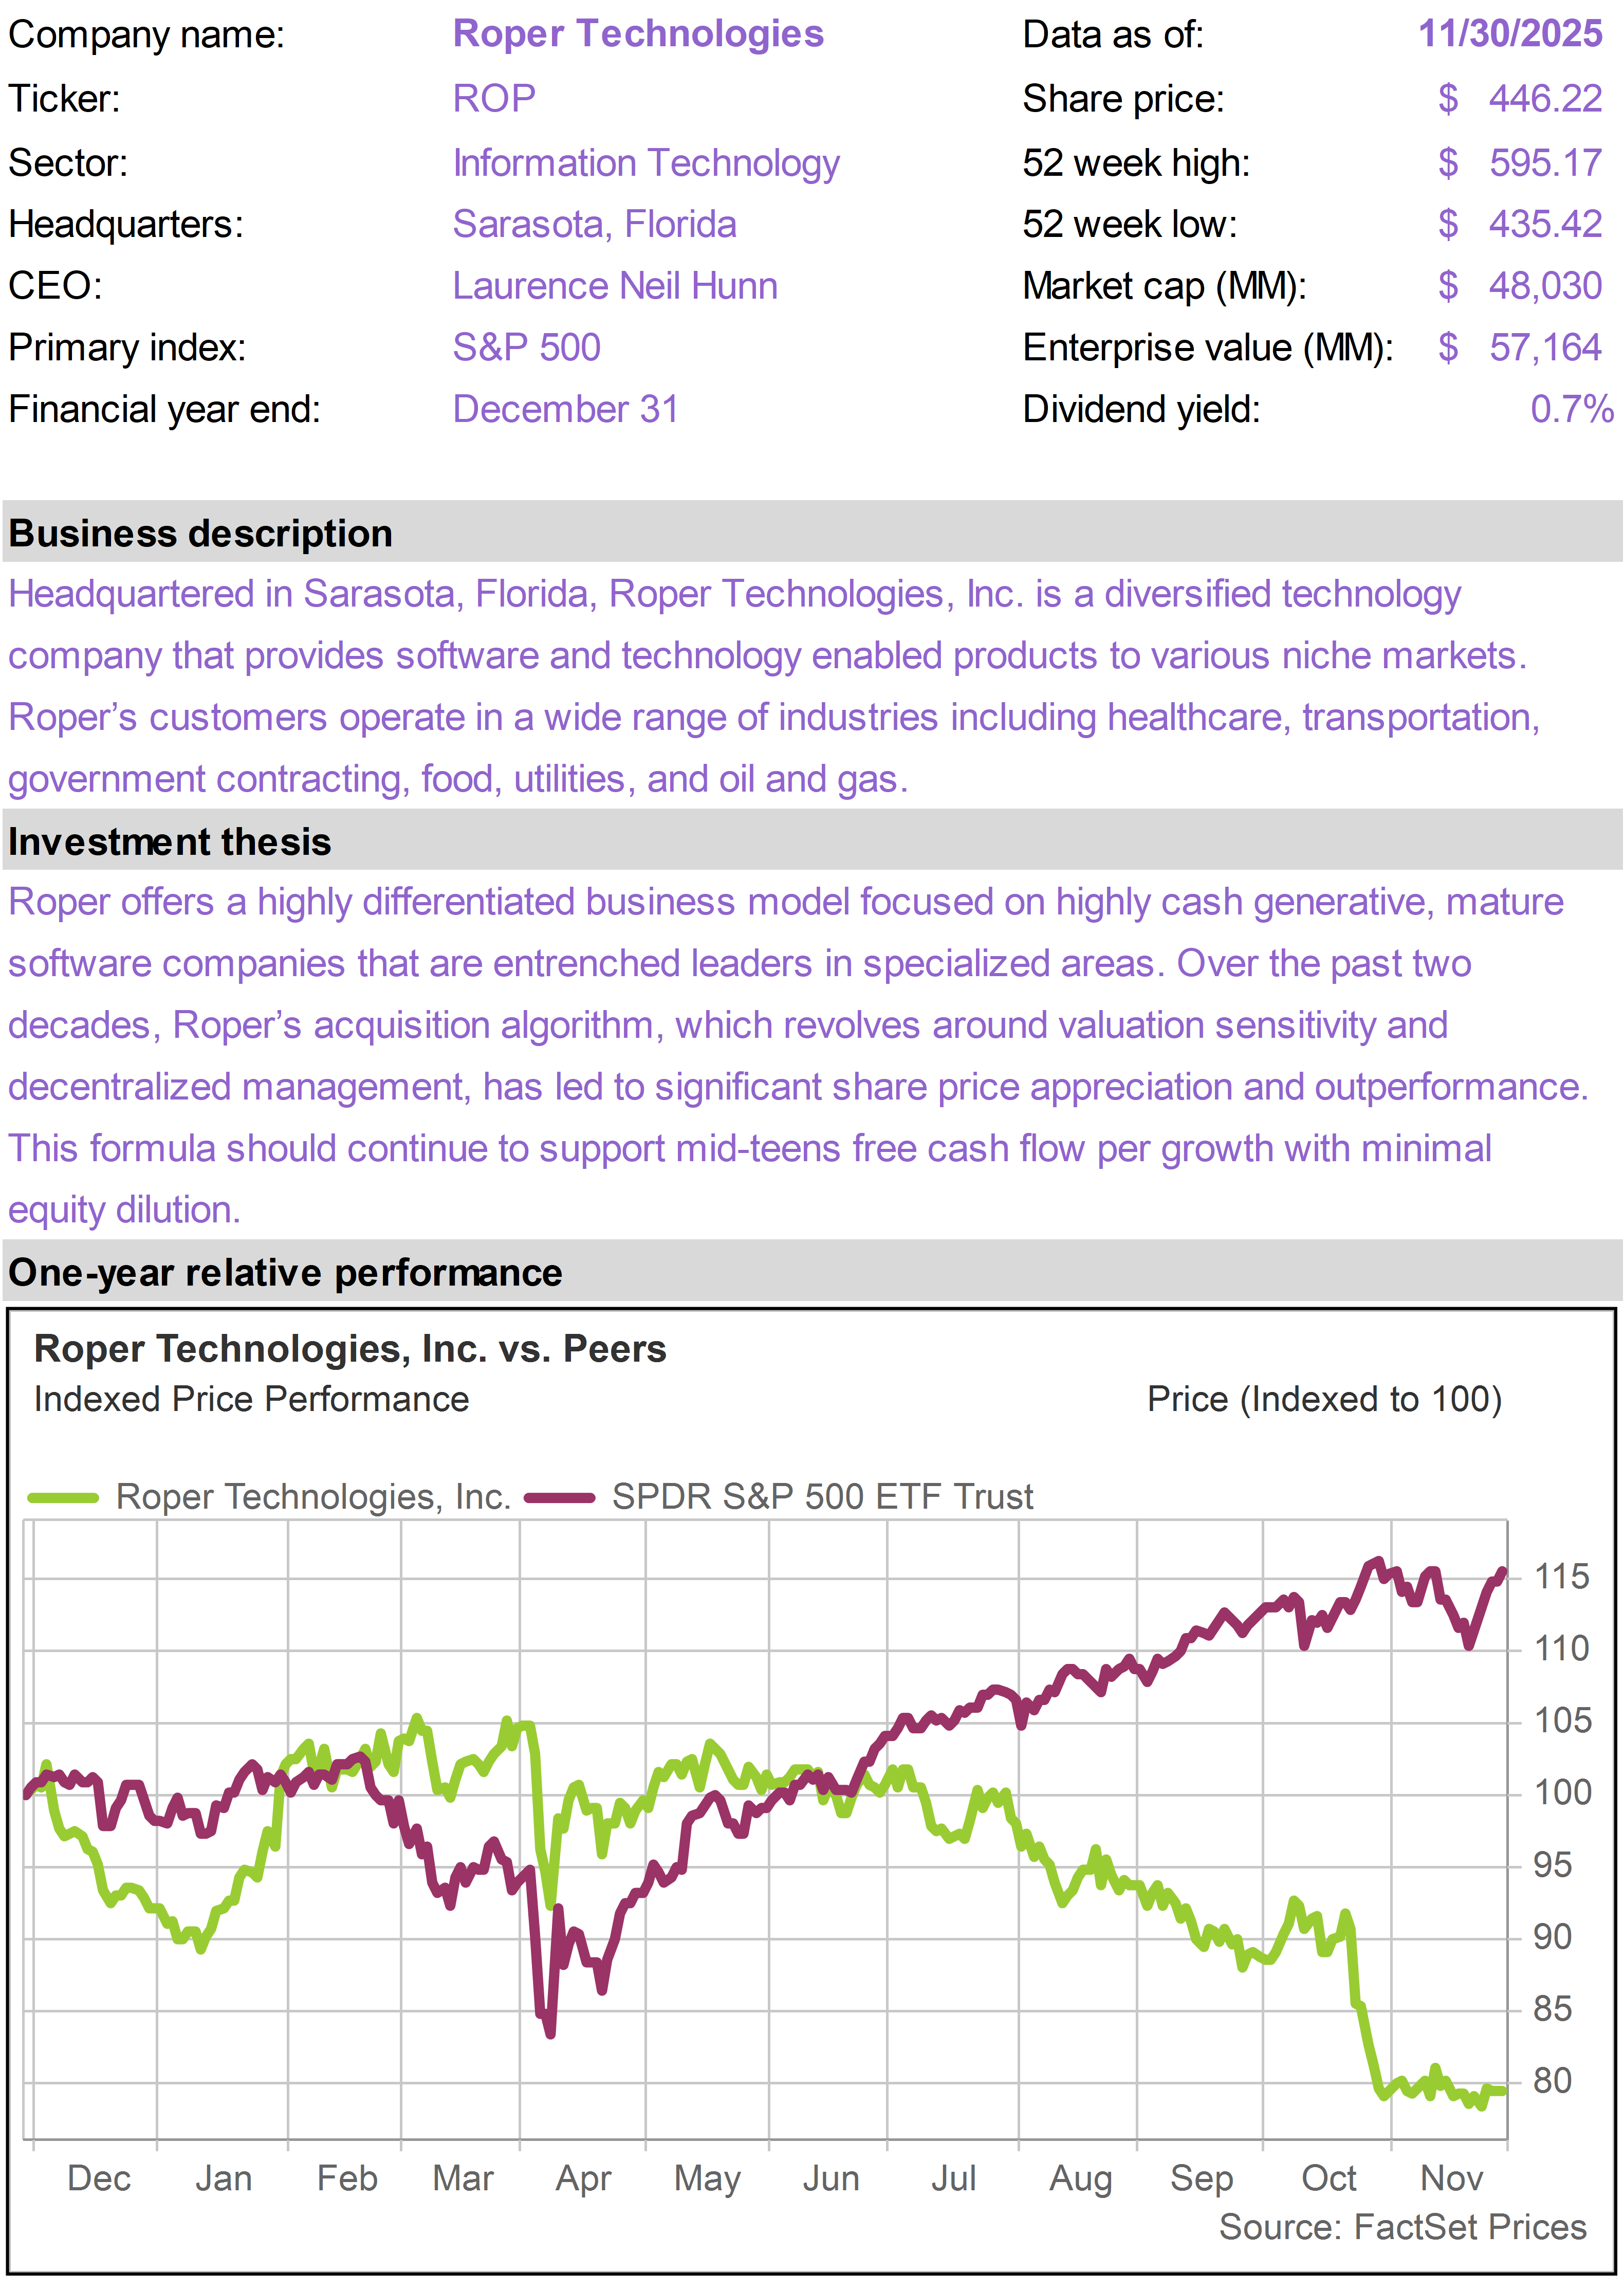
ACGL shares gained momentum after a solid late October earnings beat and well-received conference call. The insurer is benefiting from strong underwriting conditions, with loss ratios trending favorably across its property and casualty and mortgage lines.


Reinsurance pricing remained firm entering year-end, creating further confidence in ACGL’s ability to generate mid-teens returns on equity. This consistent execution has made ACGL one of the most reliable long-term performers in the insurance sector.


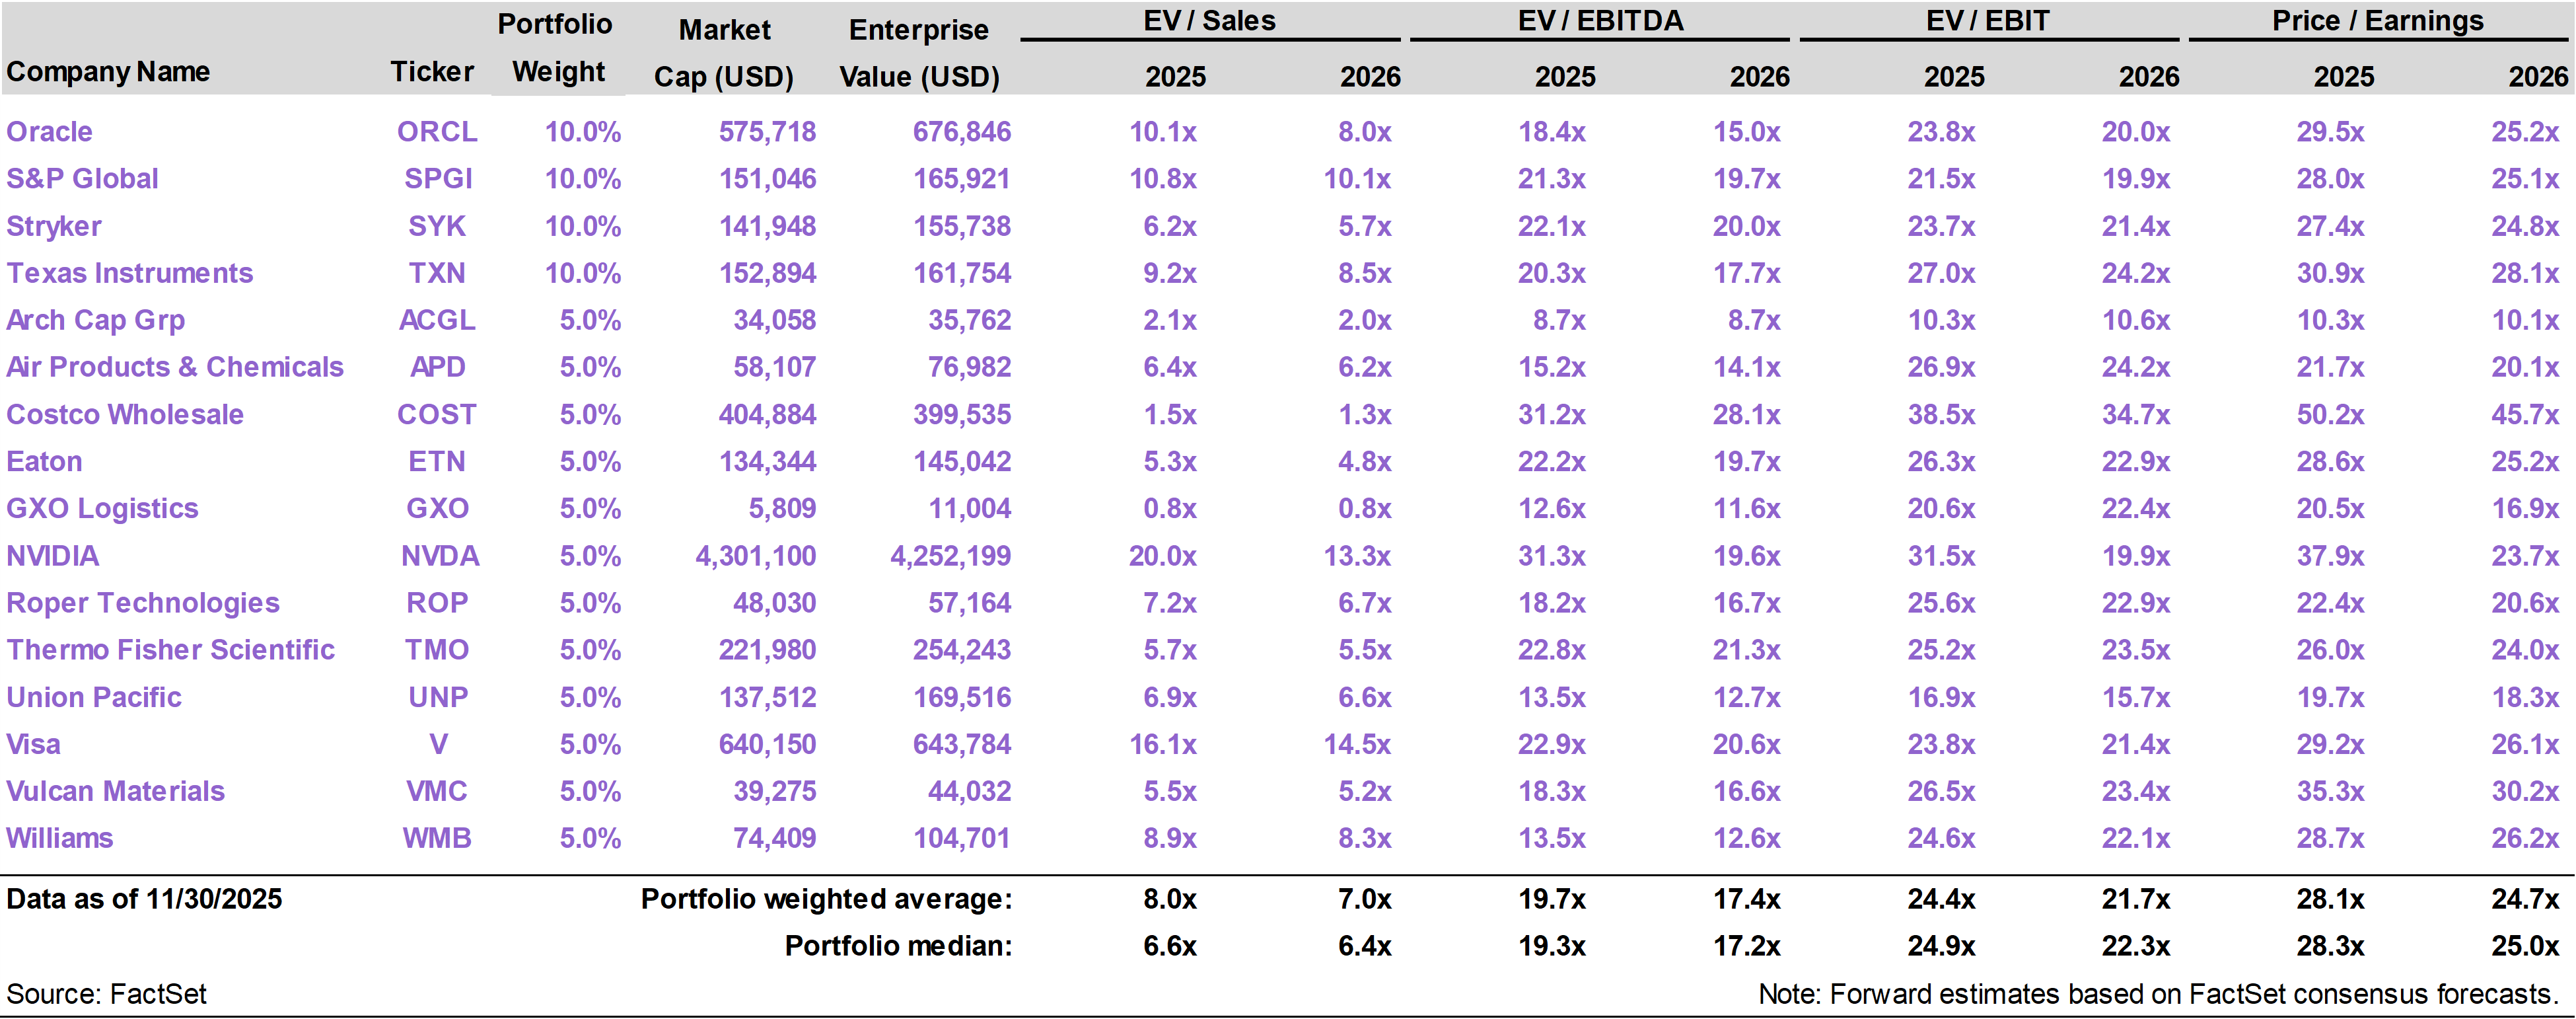
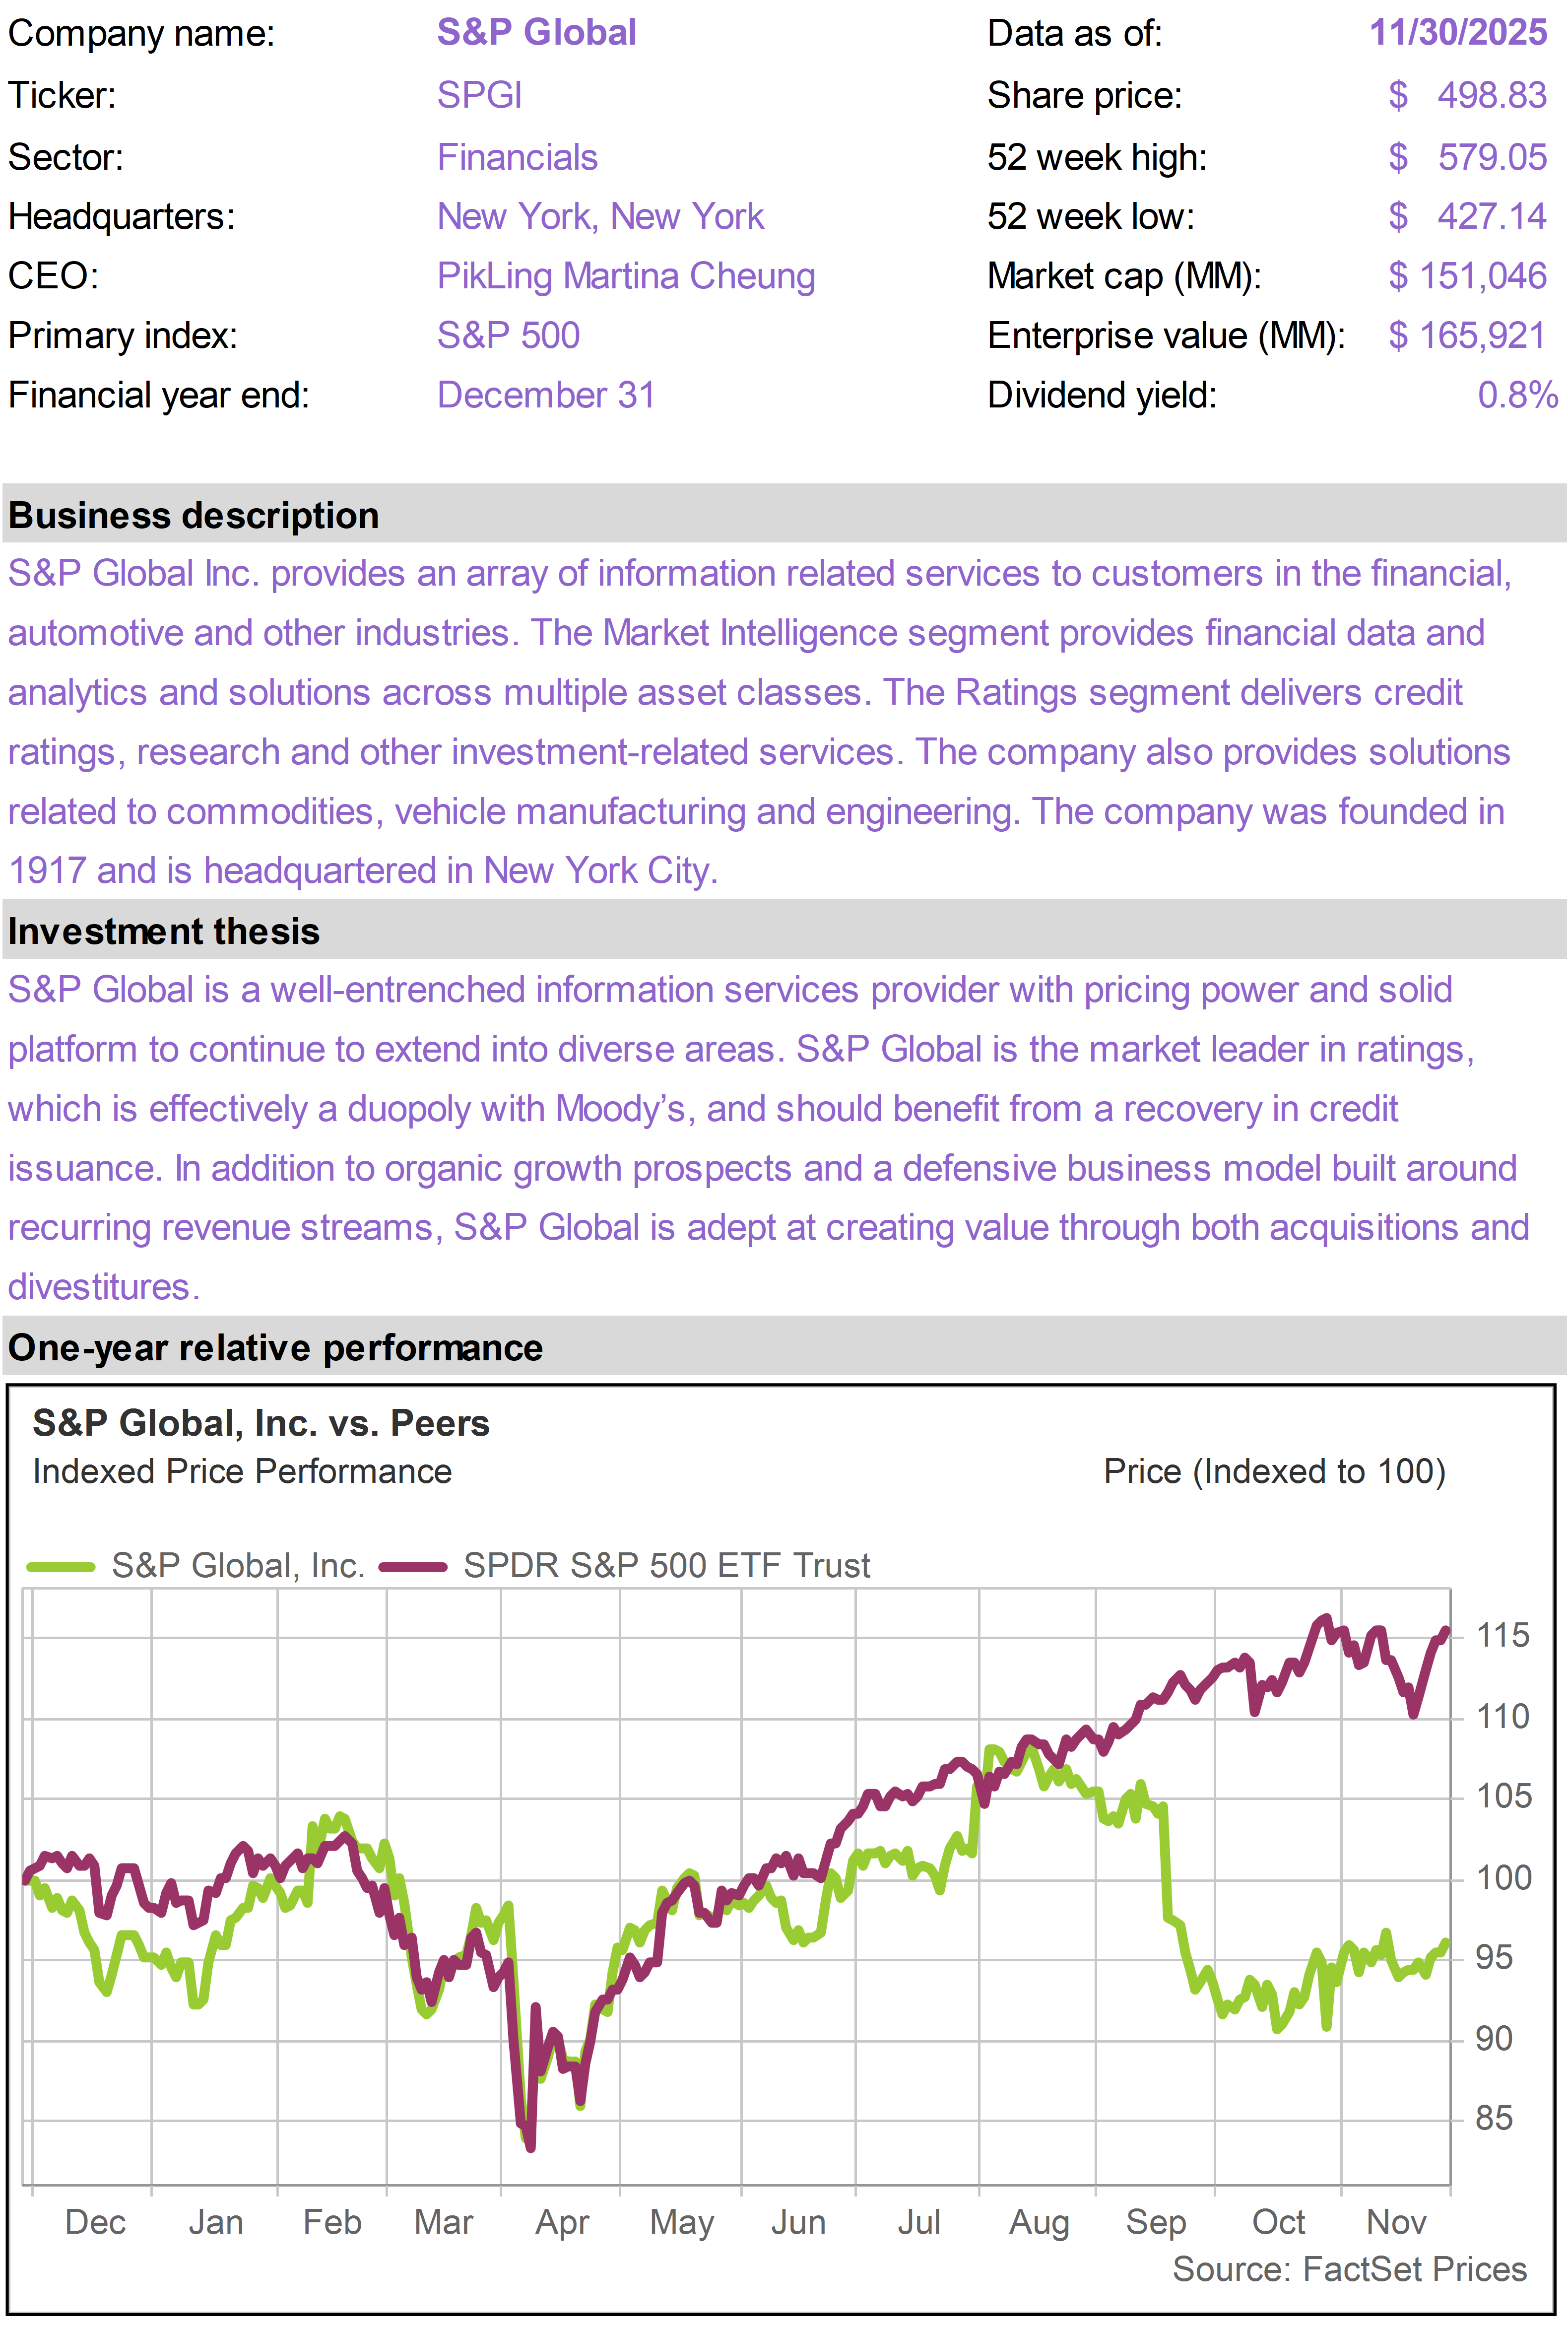
ACGL likely also benefited from sector rotation. From a valuation perspective (price to book and price to earnings), the stock’s valuation is now modest by historical standards.


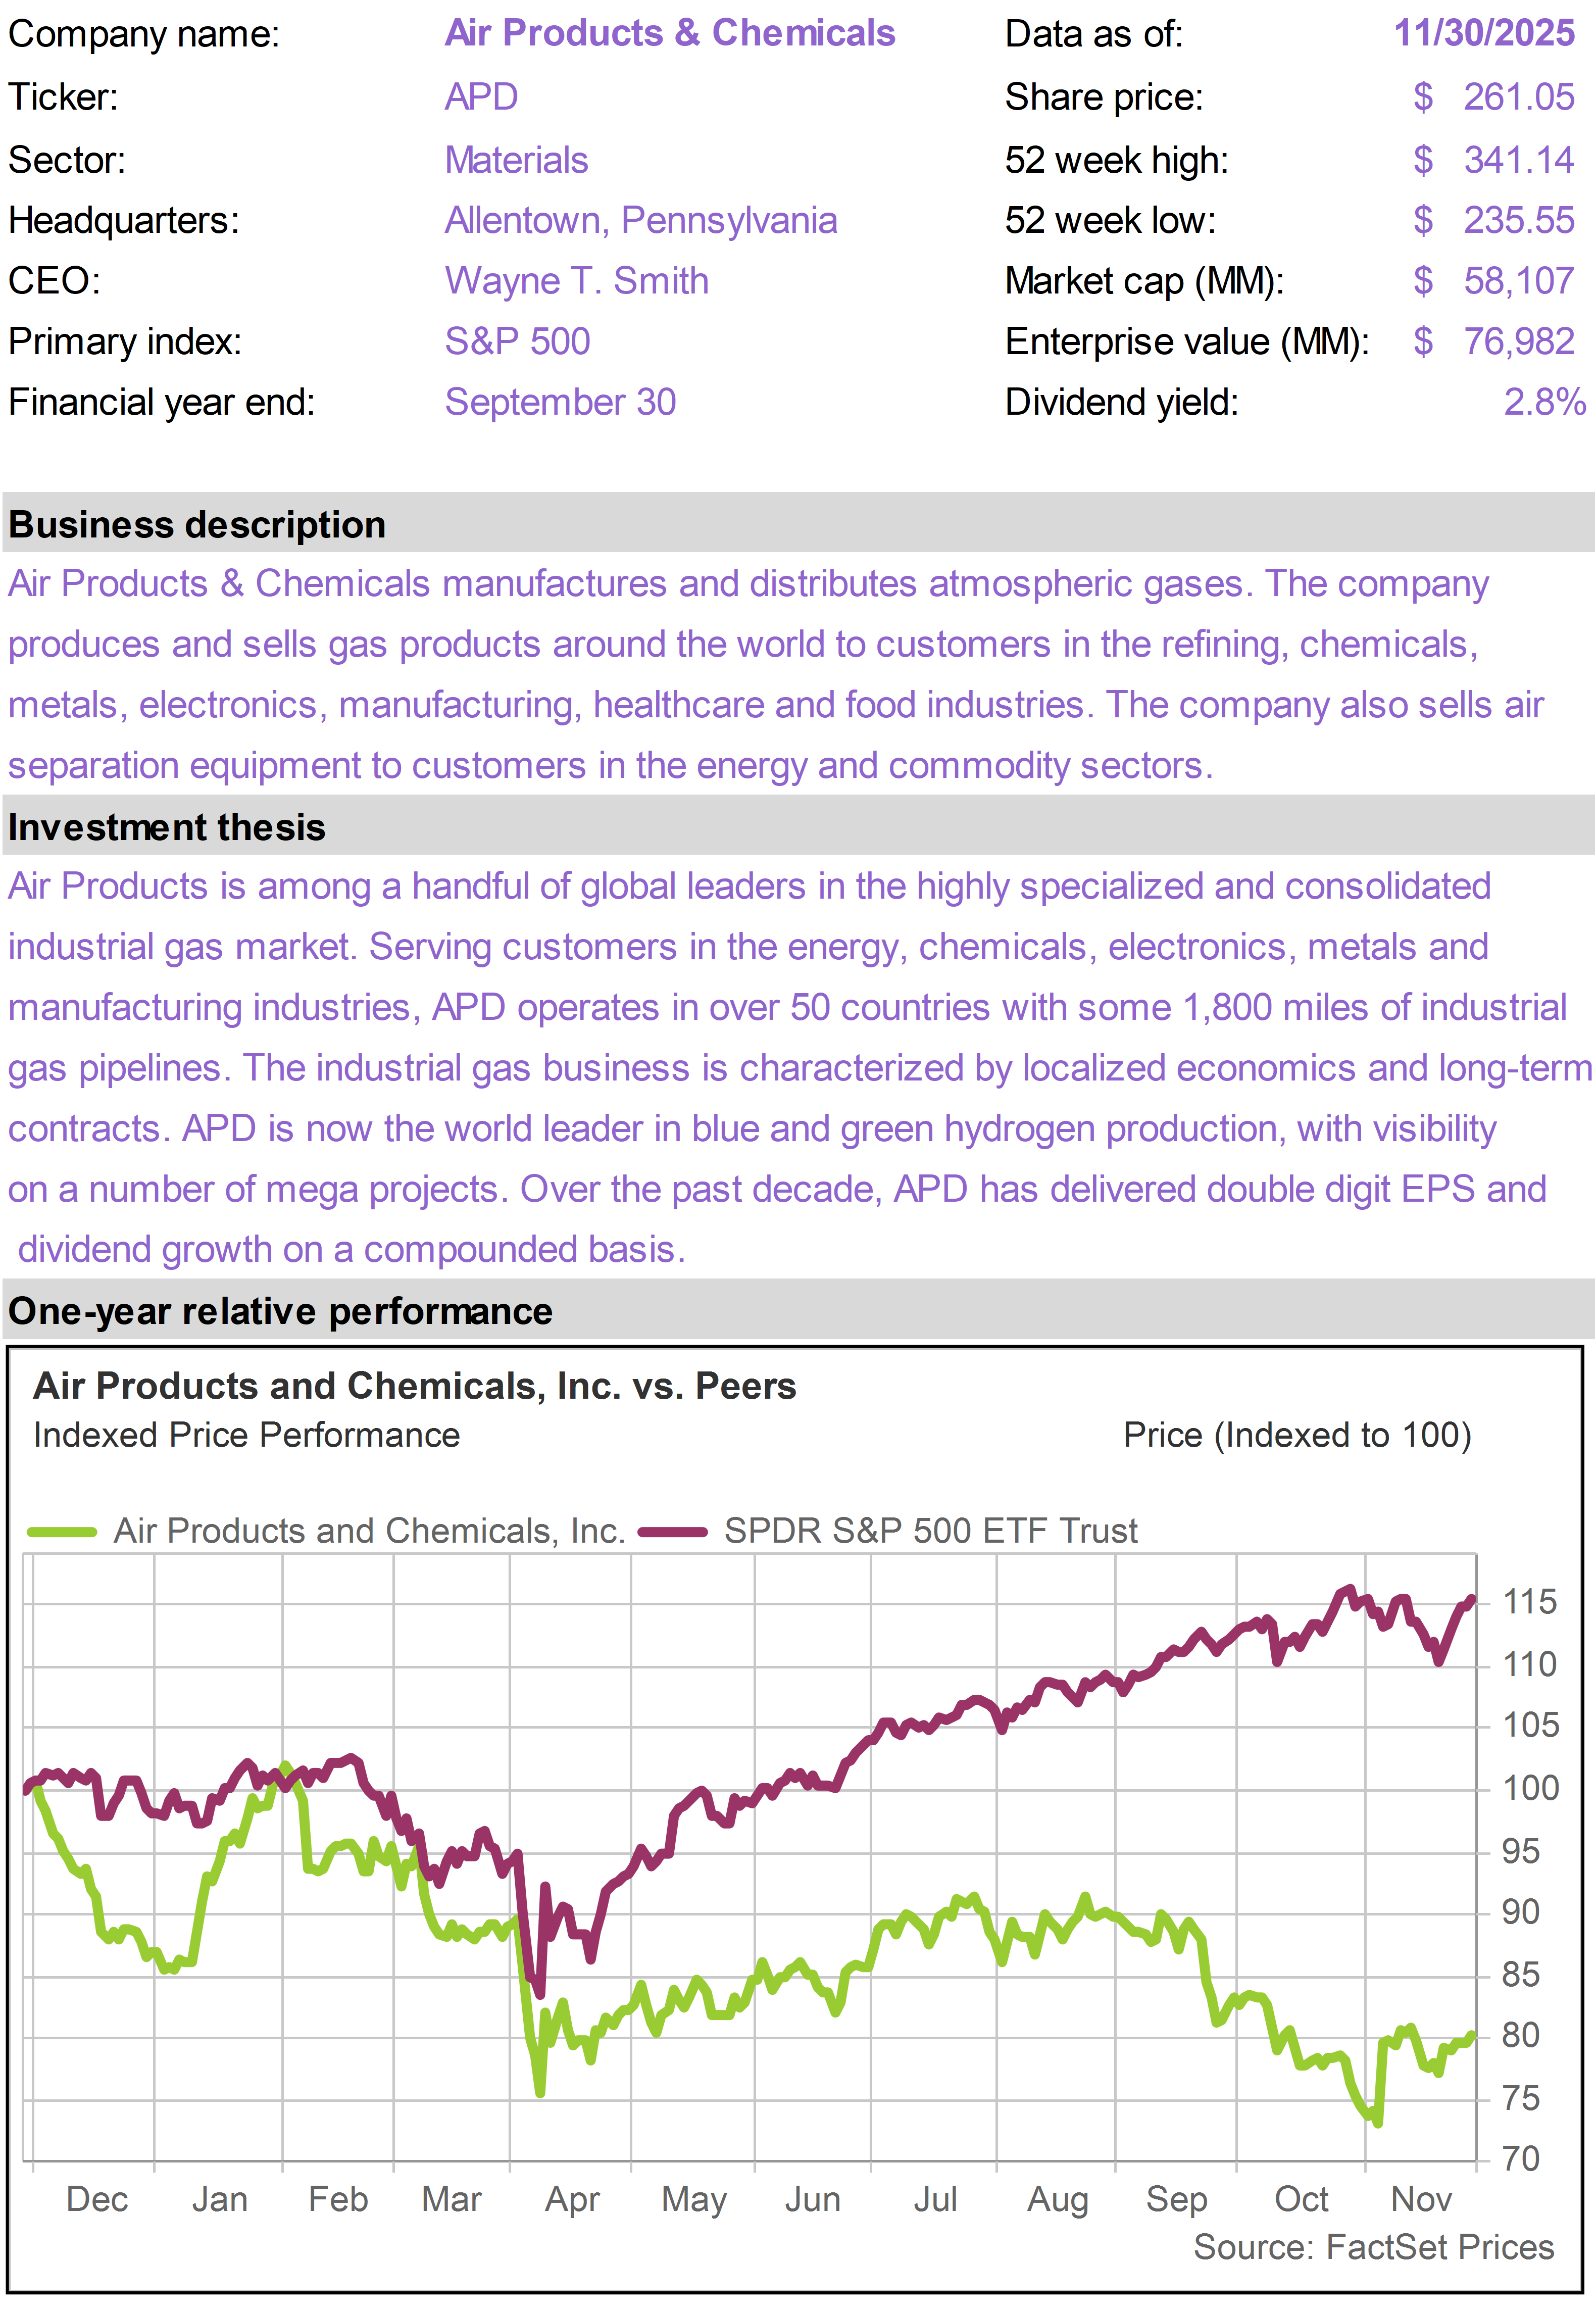
APD continued to rebuild investor confidence under its new CEO. In November, APD delivered its second consecutive earnings beat and guided 2026 earnings growth to 7–9%, slightly above consensus, helped by better pricing, improving cost discipline, and progress on exiting underperforming projects.


Margins improved during the quarter, and APD reiterated its focus on traditional industrial gas projects where returns are more predictable. With clearer execution, a more achievable capital spending plan, and signs that earnings growth is stabilizing, investors gained confidence in the company’s ability to deliver on its multi-year growth outlook.


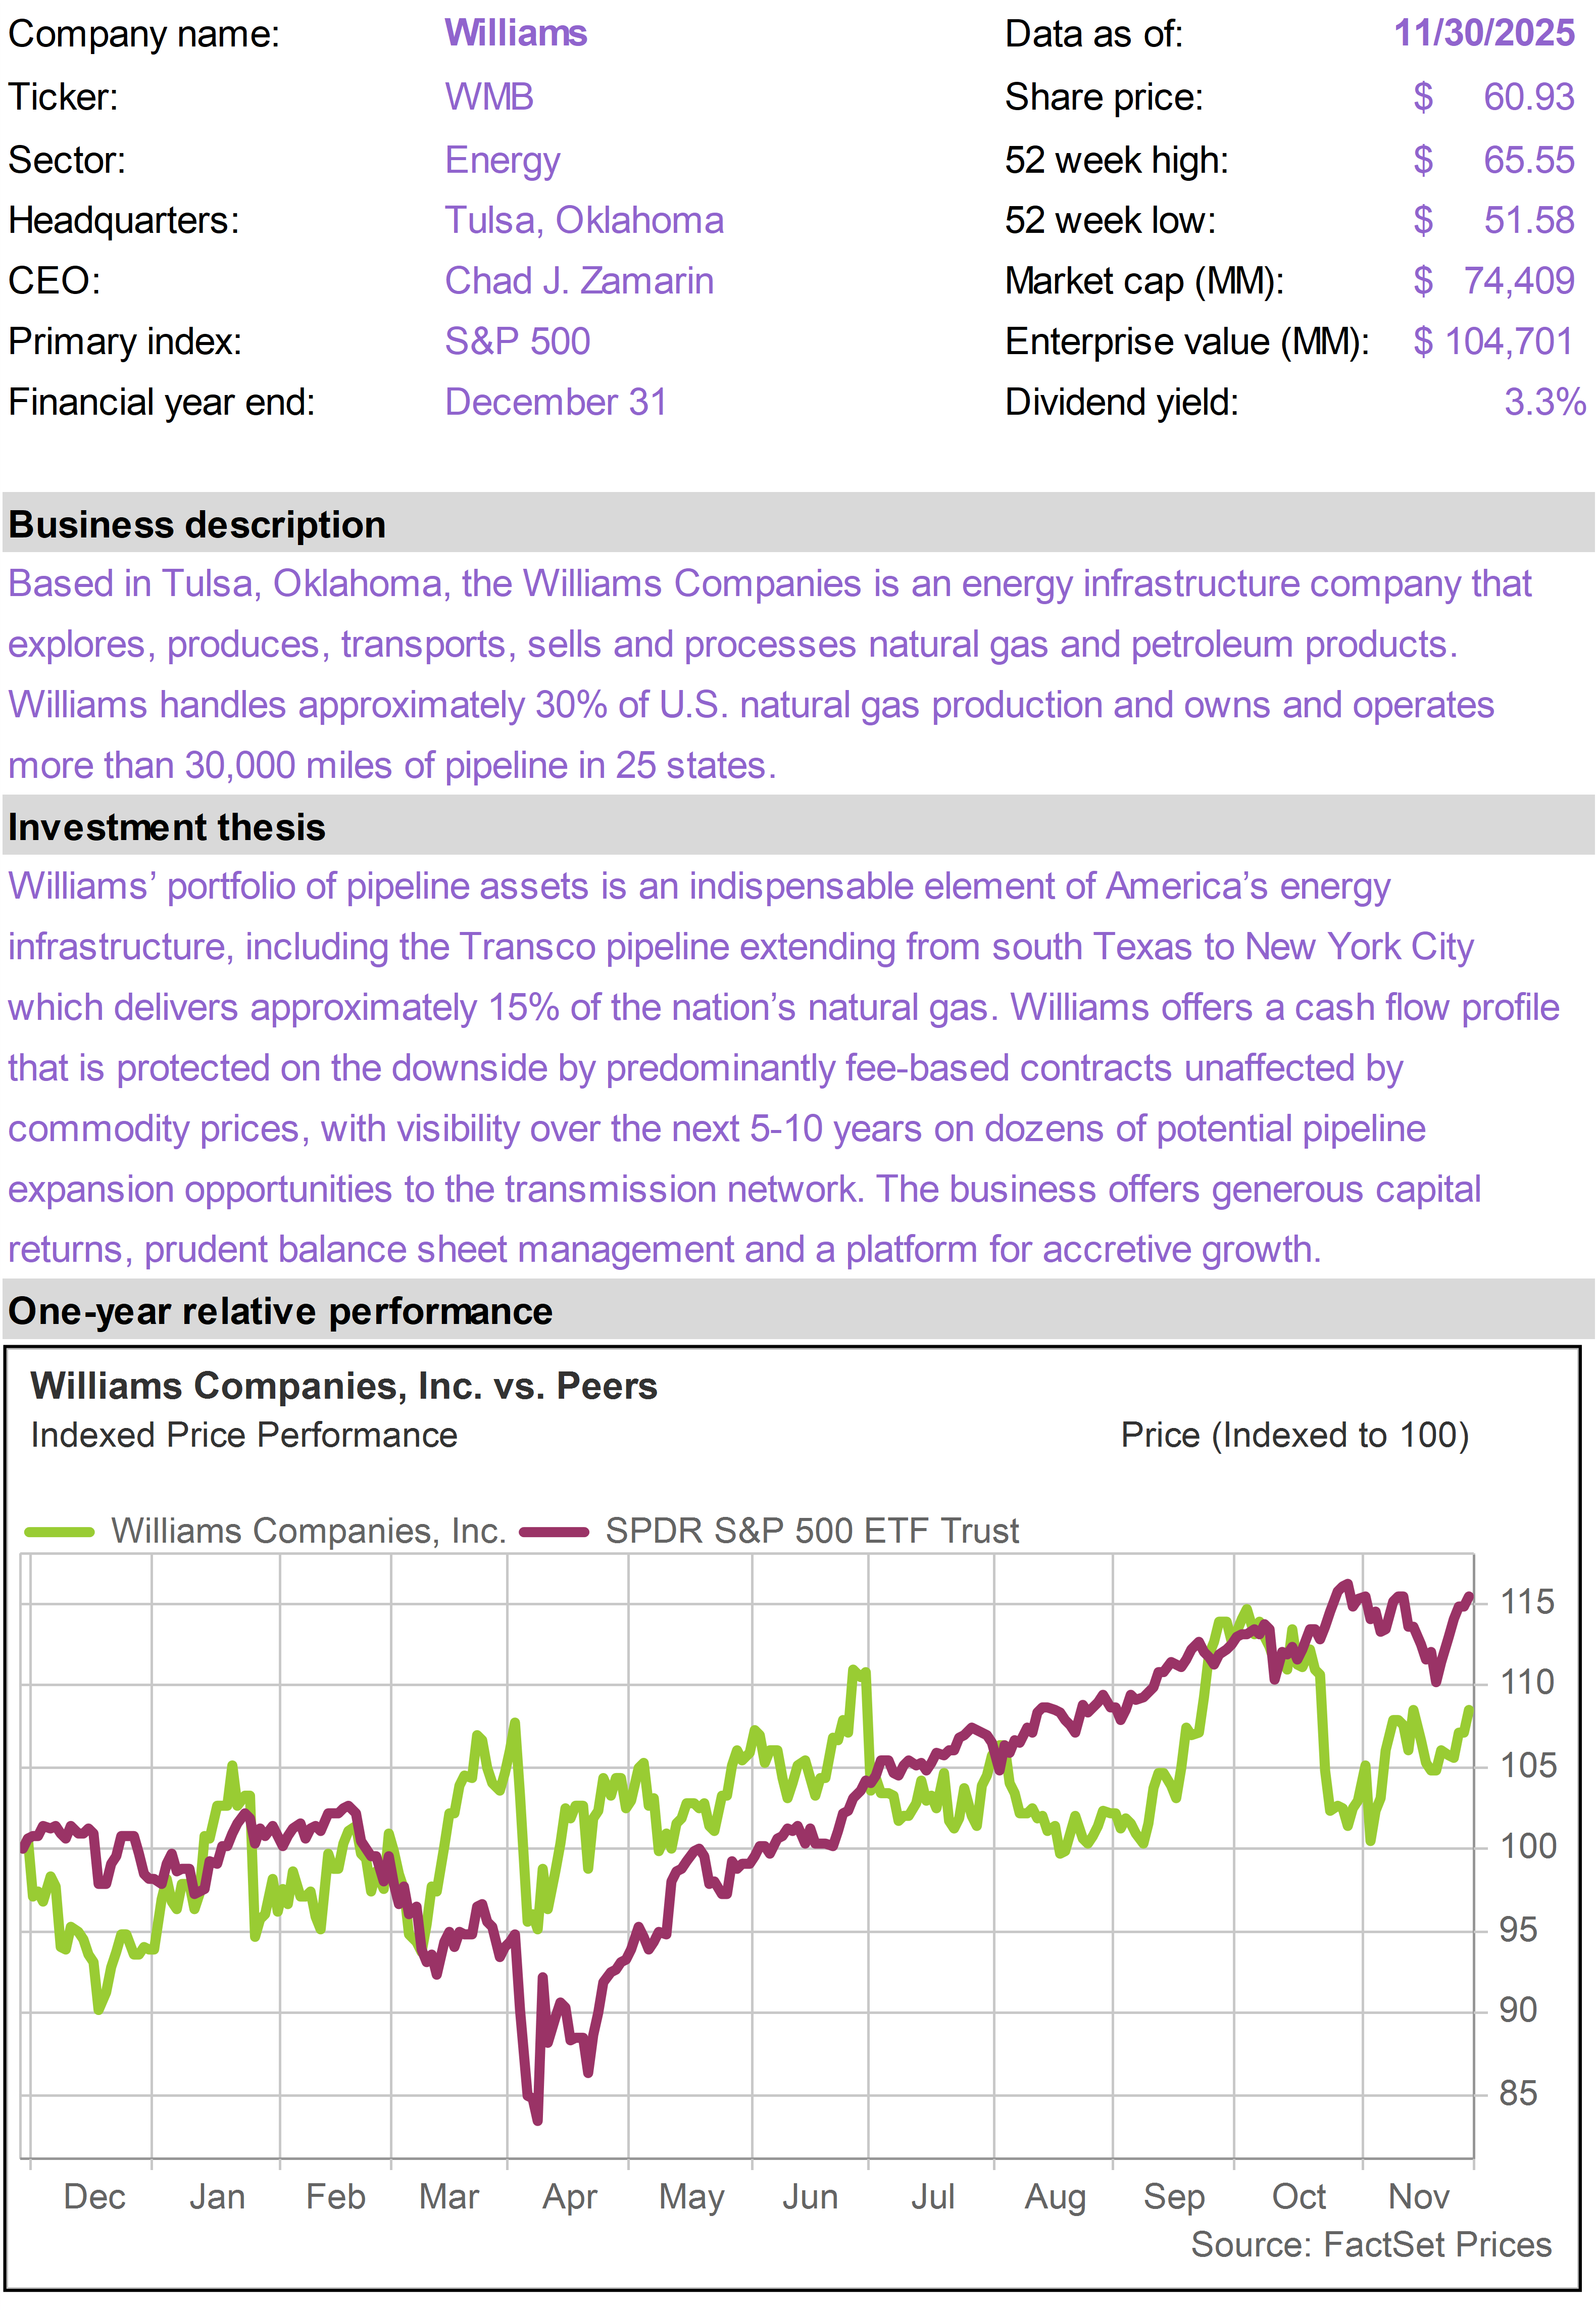
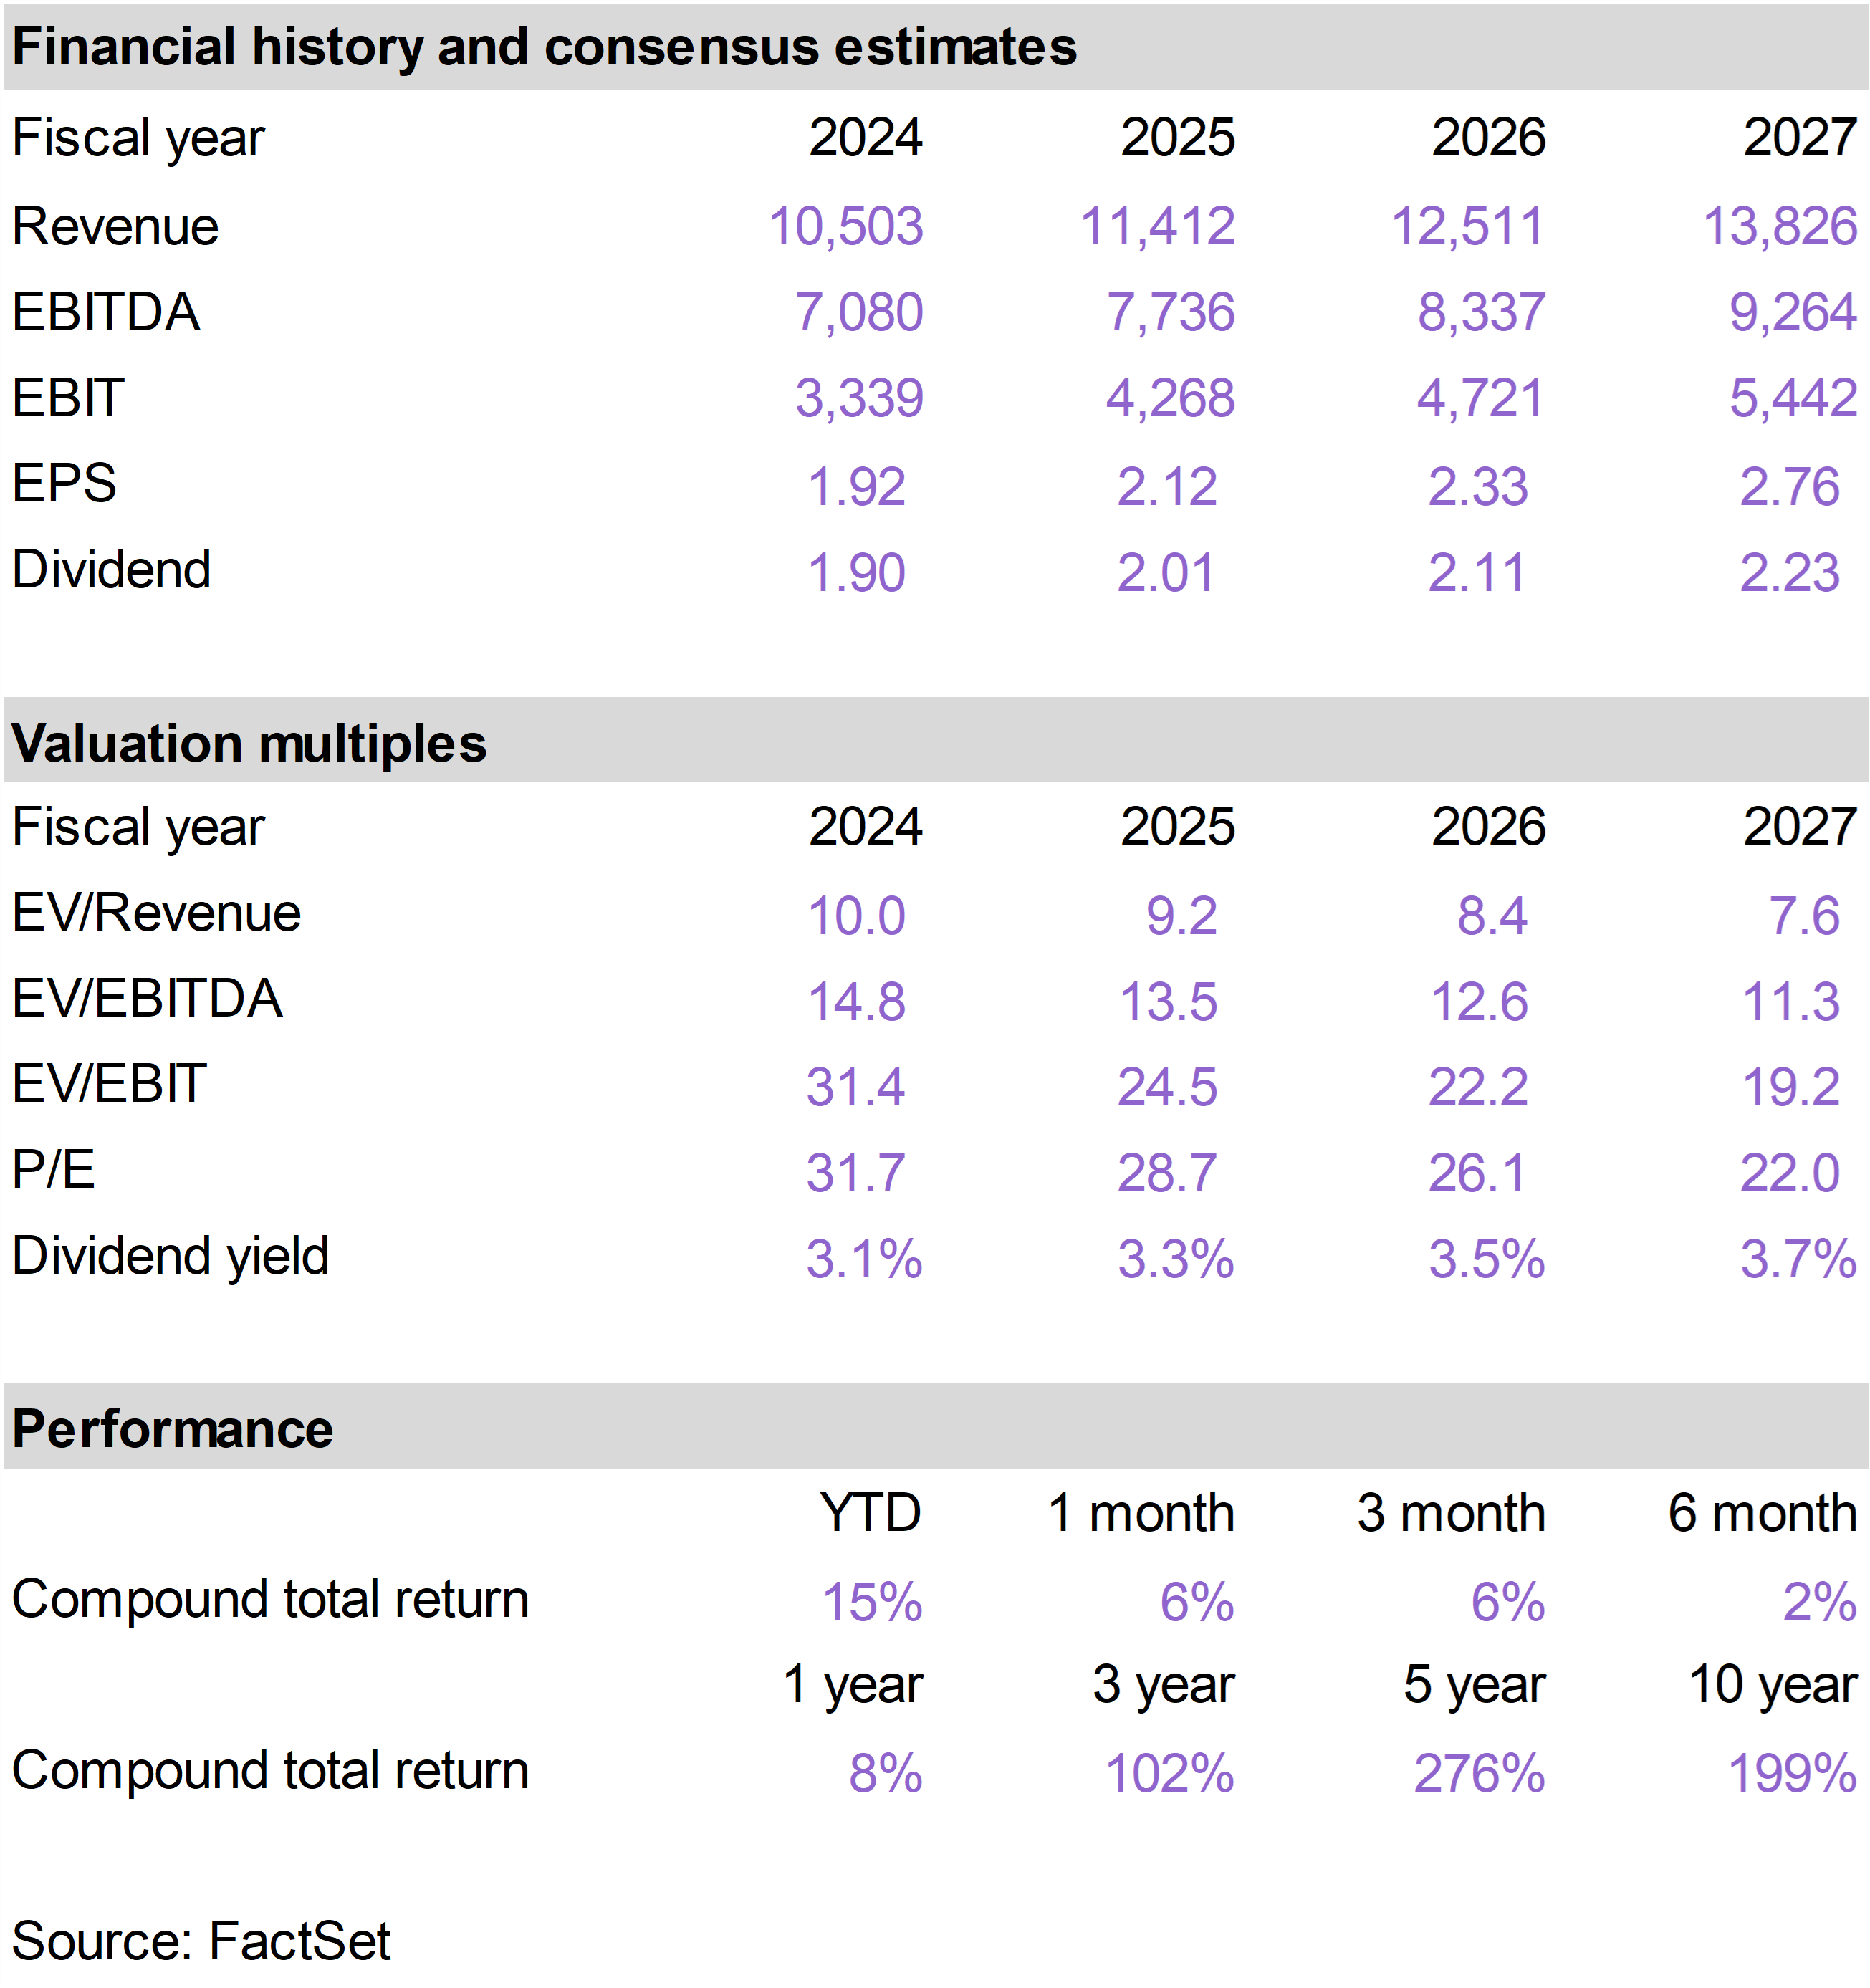
WMB reaffirmed its 2025 EBITDA guidance and delivered steady, fee-based third quarter results. Several new pipeline and storage projects were announced, adding to the company’s long-term growth pipeline.


In February, WMB will host its Analyst Day, which could serve as a meaningful catalyst for the stock, with a potential upward revision to its long-term EBITDA growth outlook. WMB has guided investors toward 5-7% long-term growth but has averaged 9% over the past five years.


As the largest natural gas pipeline operator, WMB is a major beneficiary of AI data center demand for electrical power, given that natural gas is the most important fuel for power generation in the U.S.  


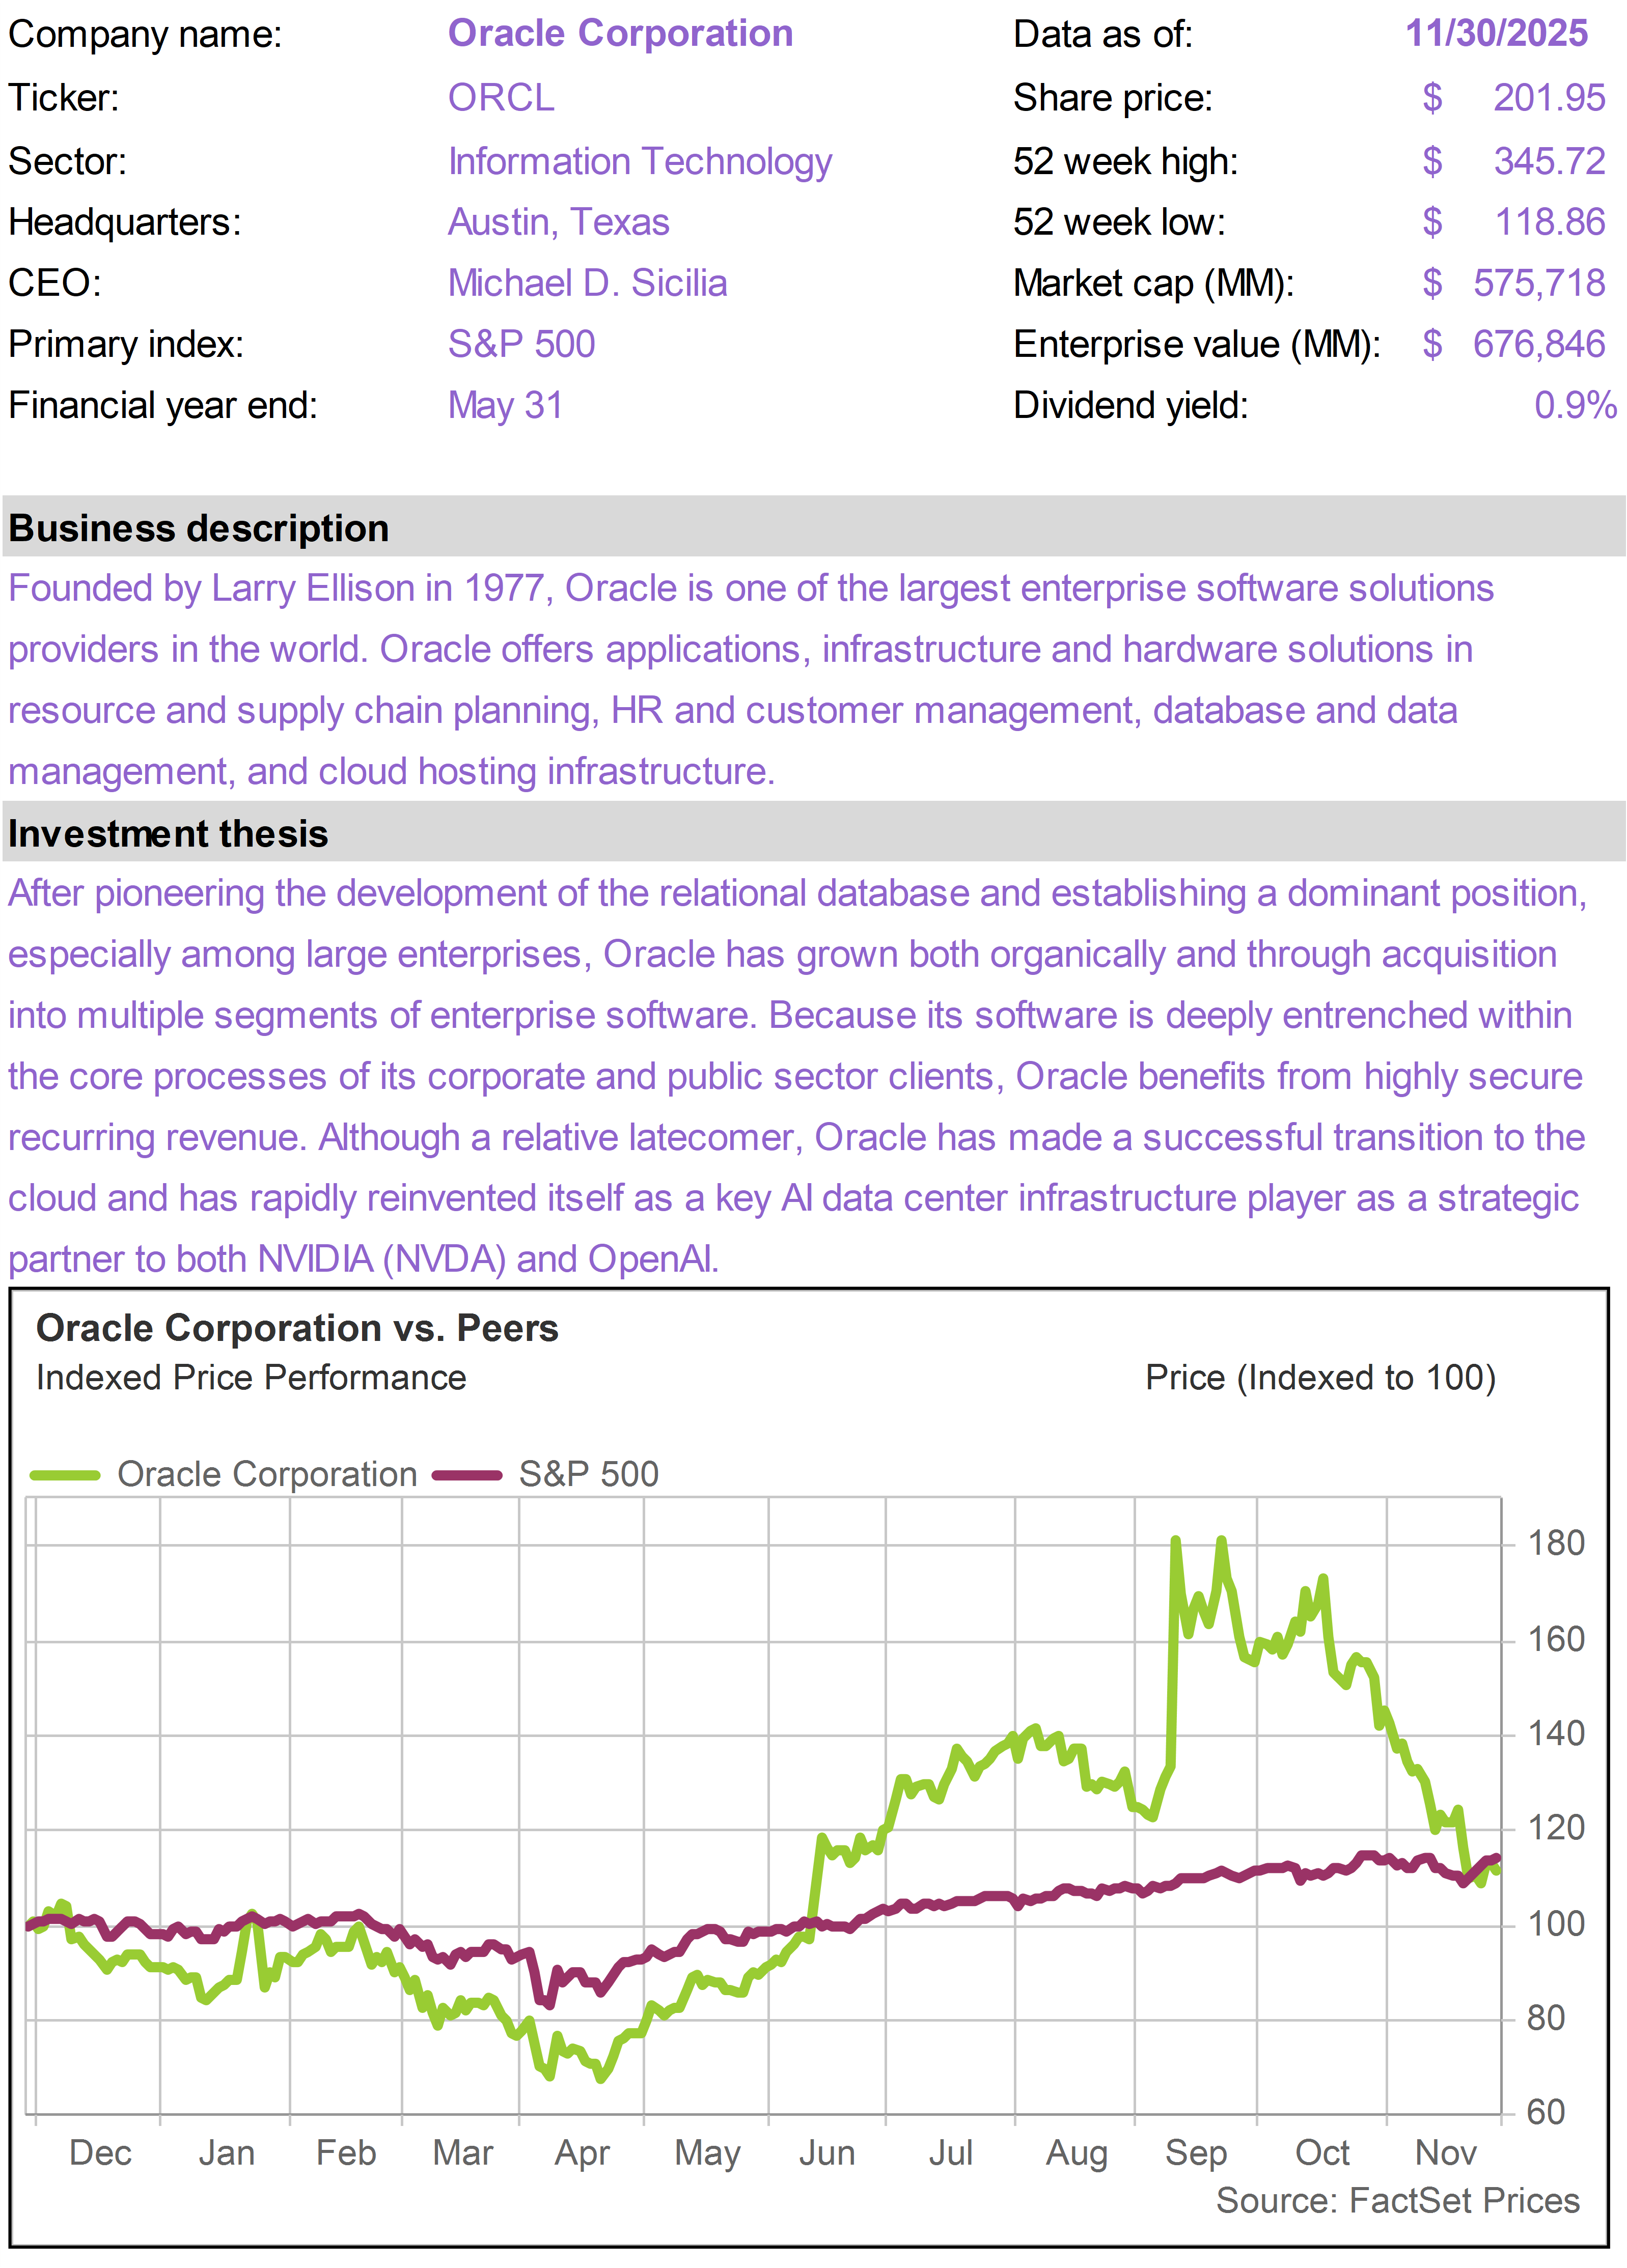
ORCL has been at the center of the AI mood shift. After soaring in recent months following disclosure of bulging order backlogs, largely driven by OpenAI, shares have declined sharply.


Investors have become concerned about the ability of OpenAI to fund its ambitious growth plans, and they are concerned about the debt ORCL needs to incur to fund its own capital spending plans.


We view the current weakness in ORCL as a compelling opportunity. Concerns about OpenAI are valid, but it is not ORCL’s only customer or long-term potential customer.


The rapid reversal in the share price overstates the risk and valuation impact. Consensus estimates still forecast ORCL earnings per share more than tripling over the next five years.


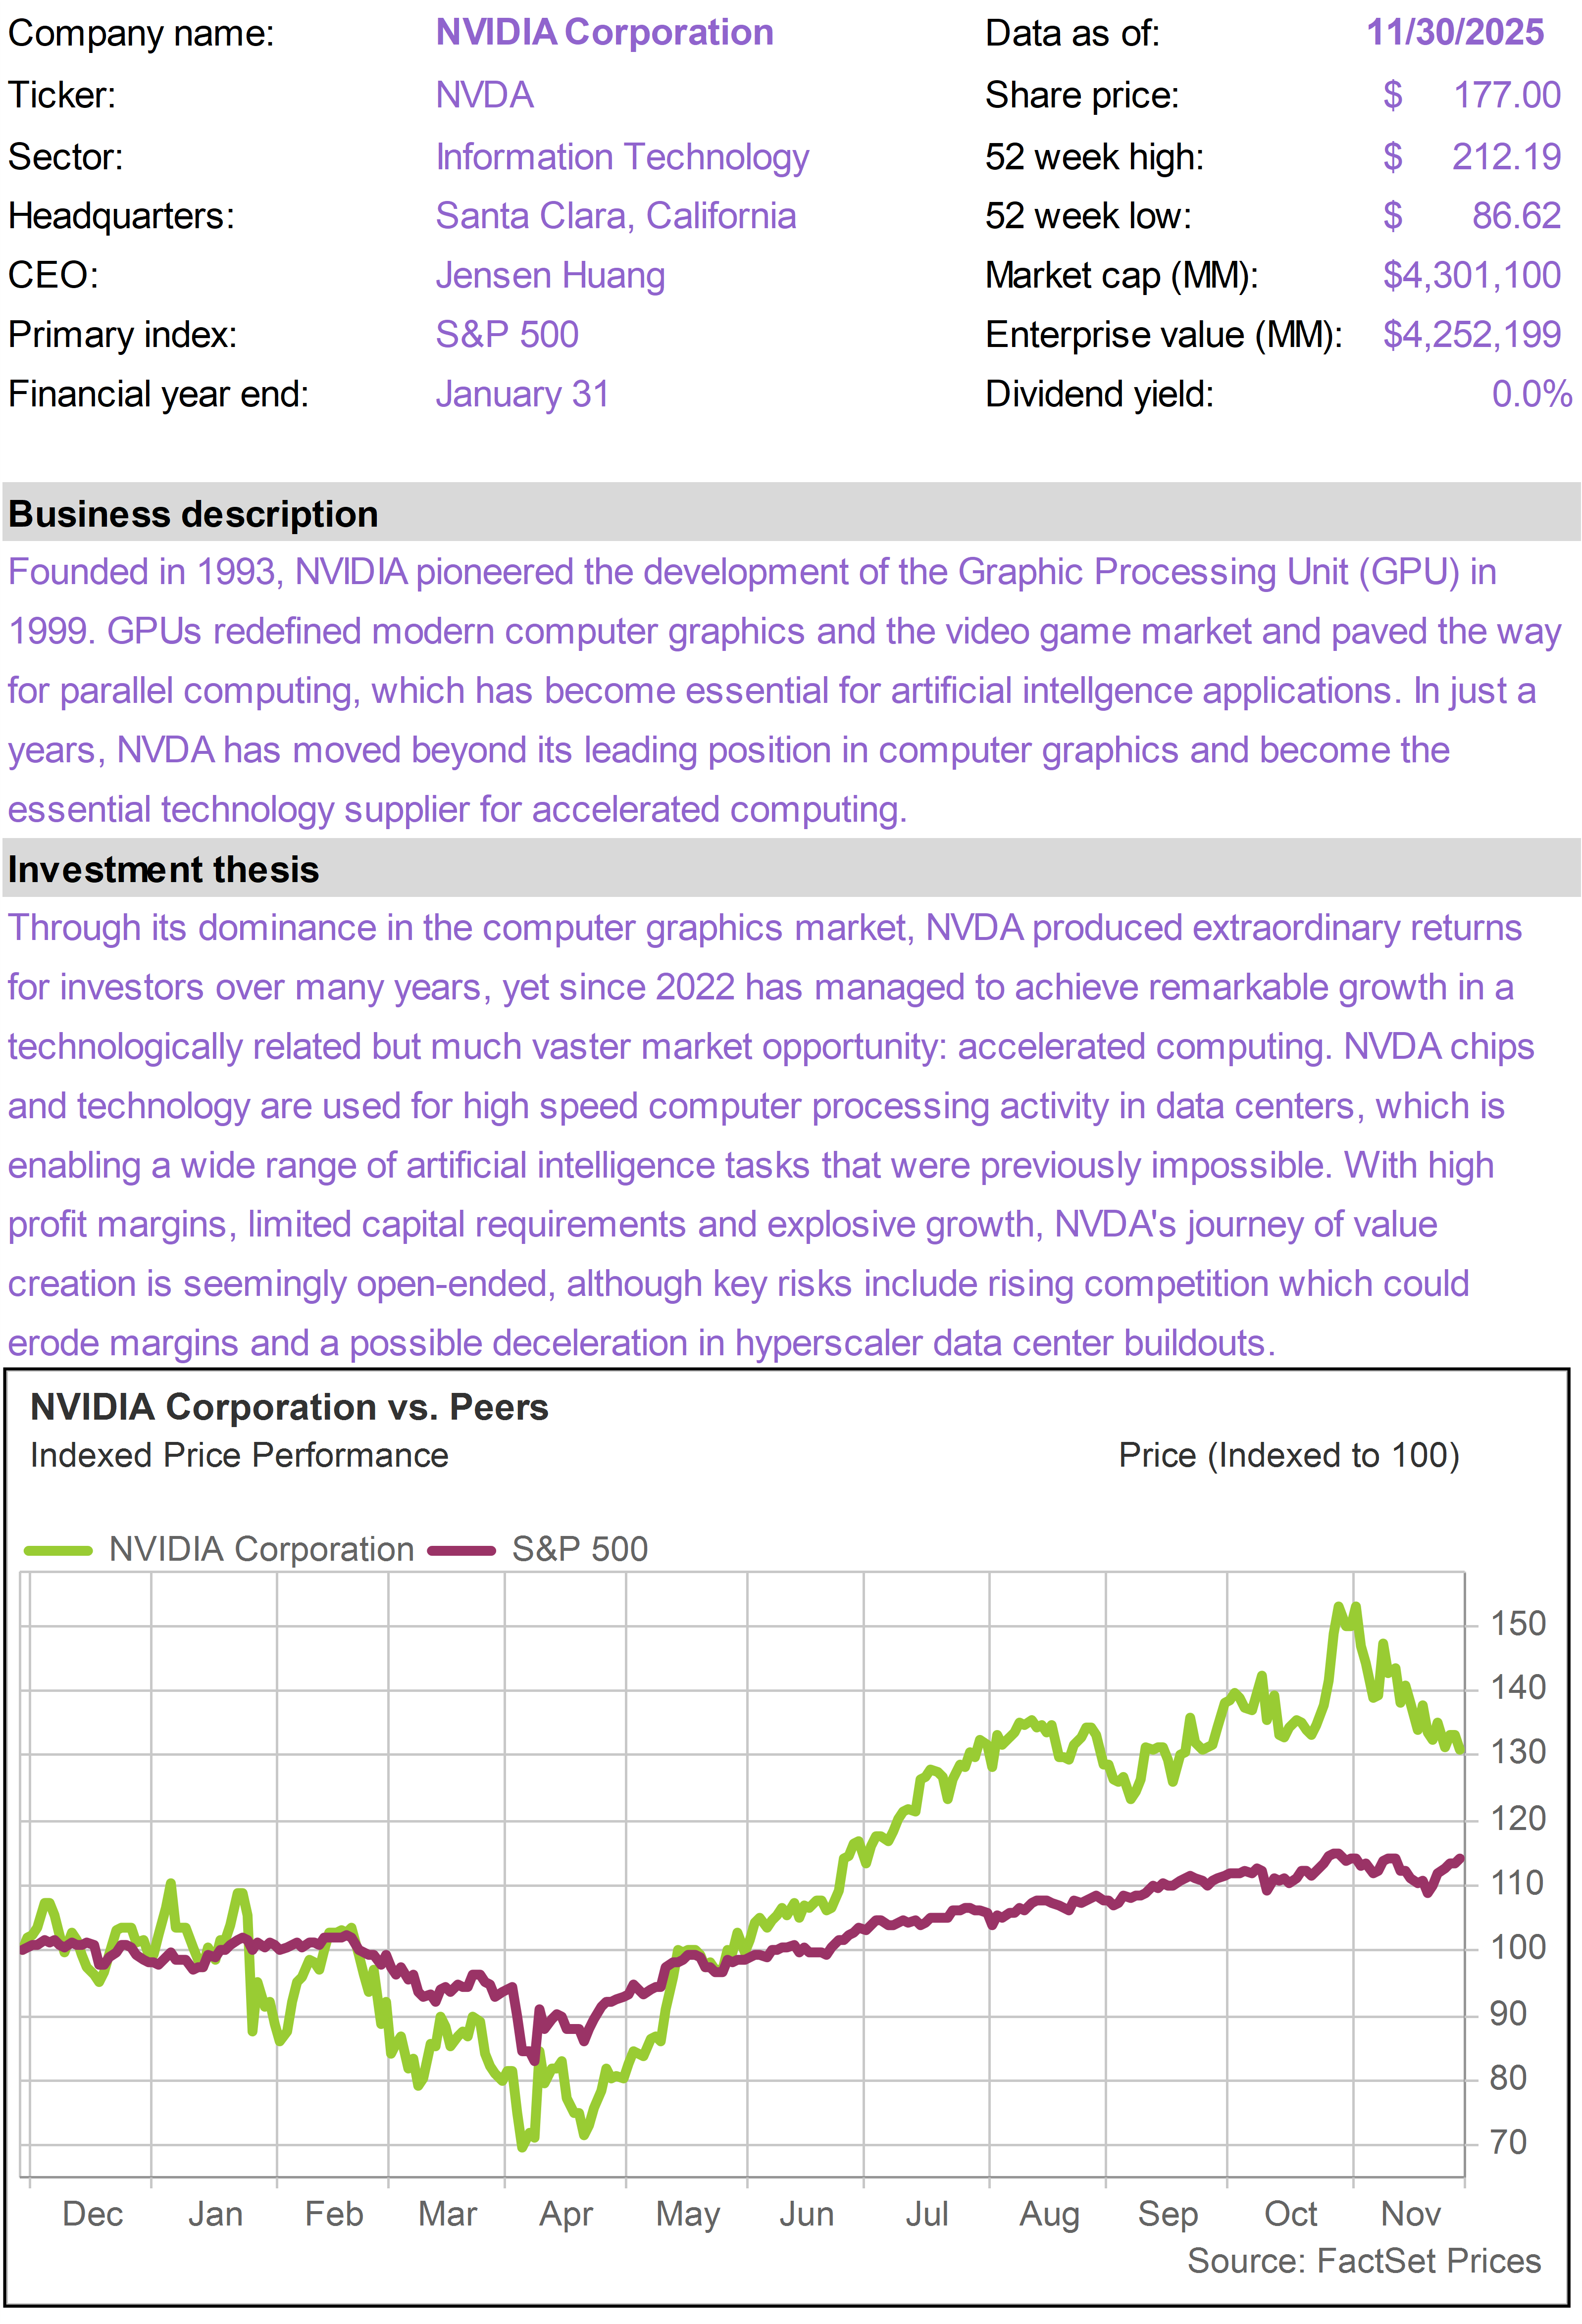
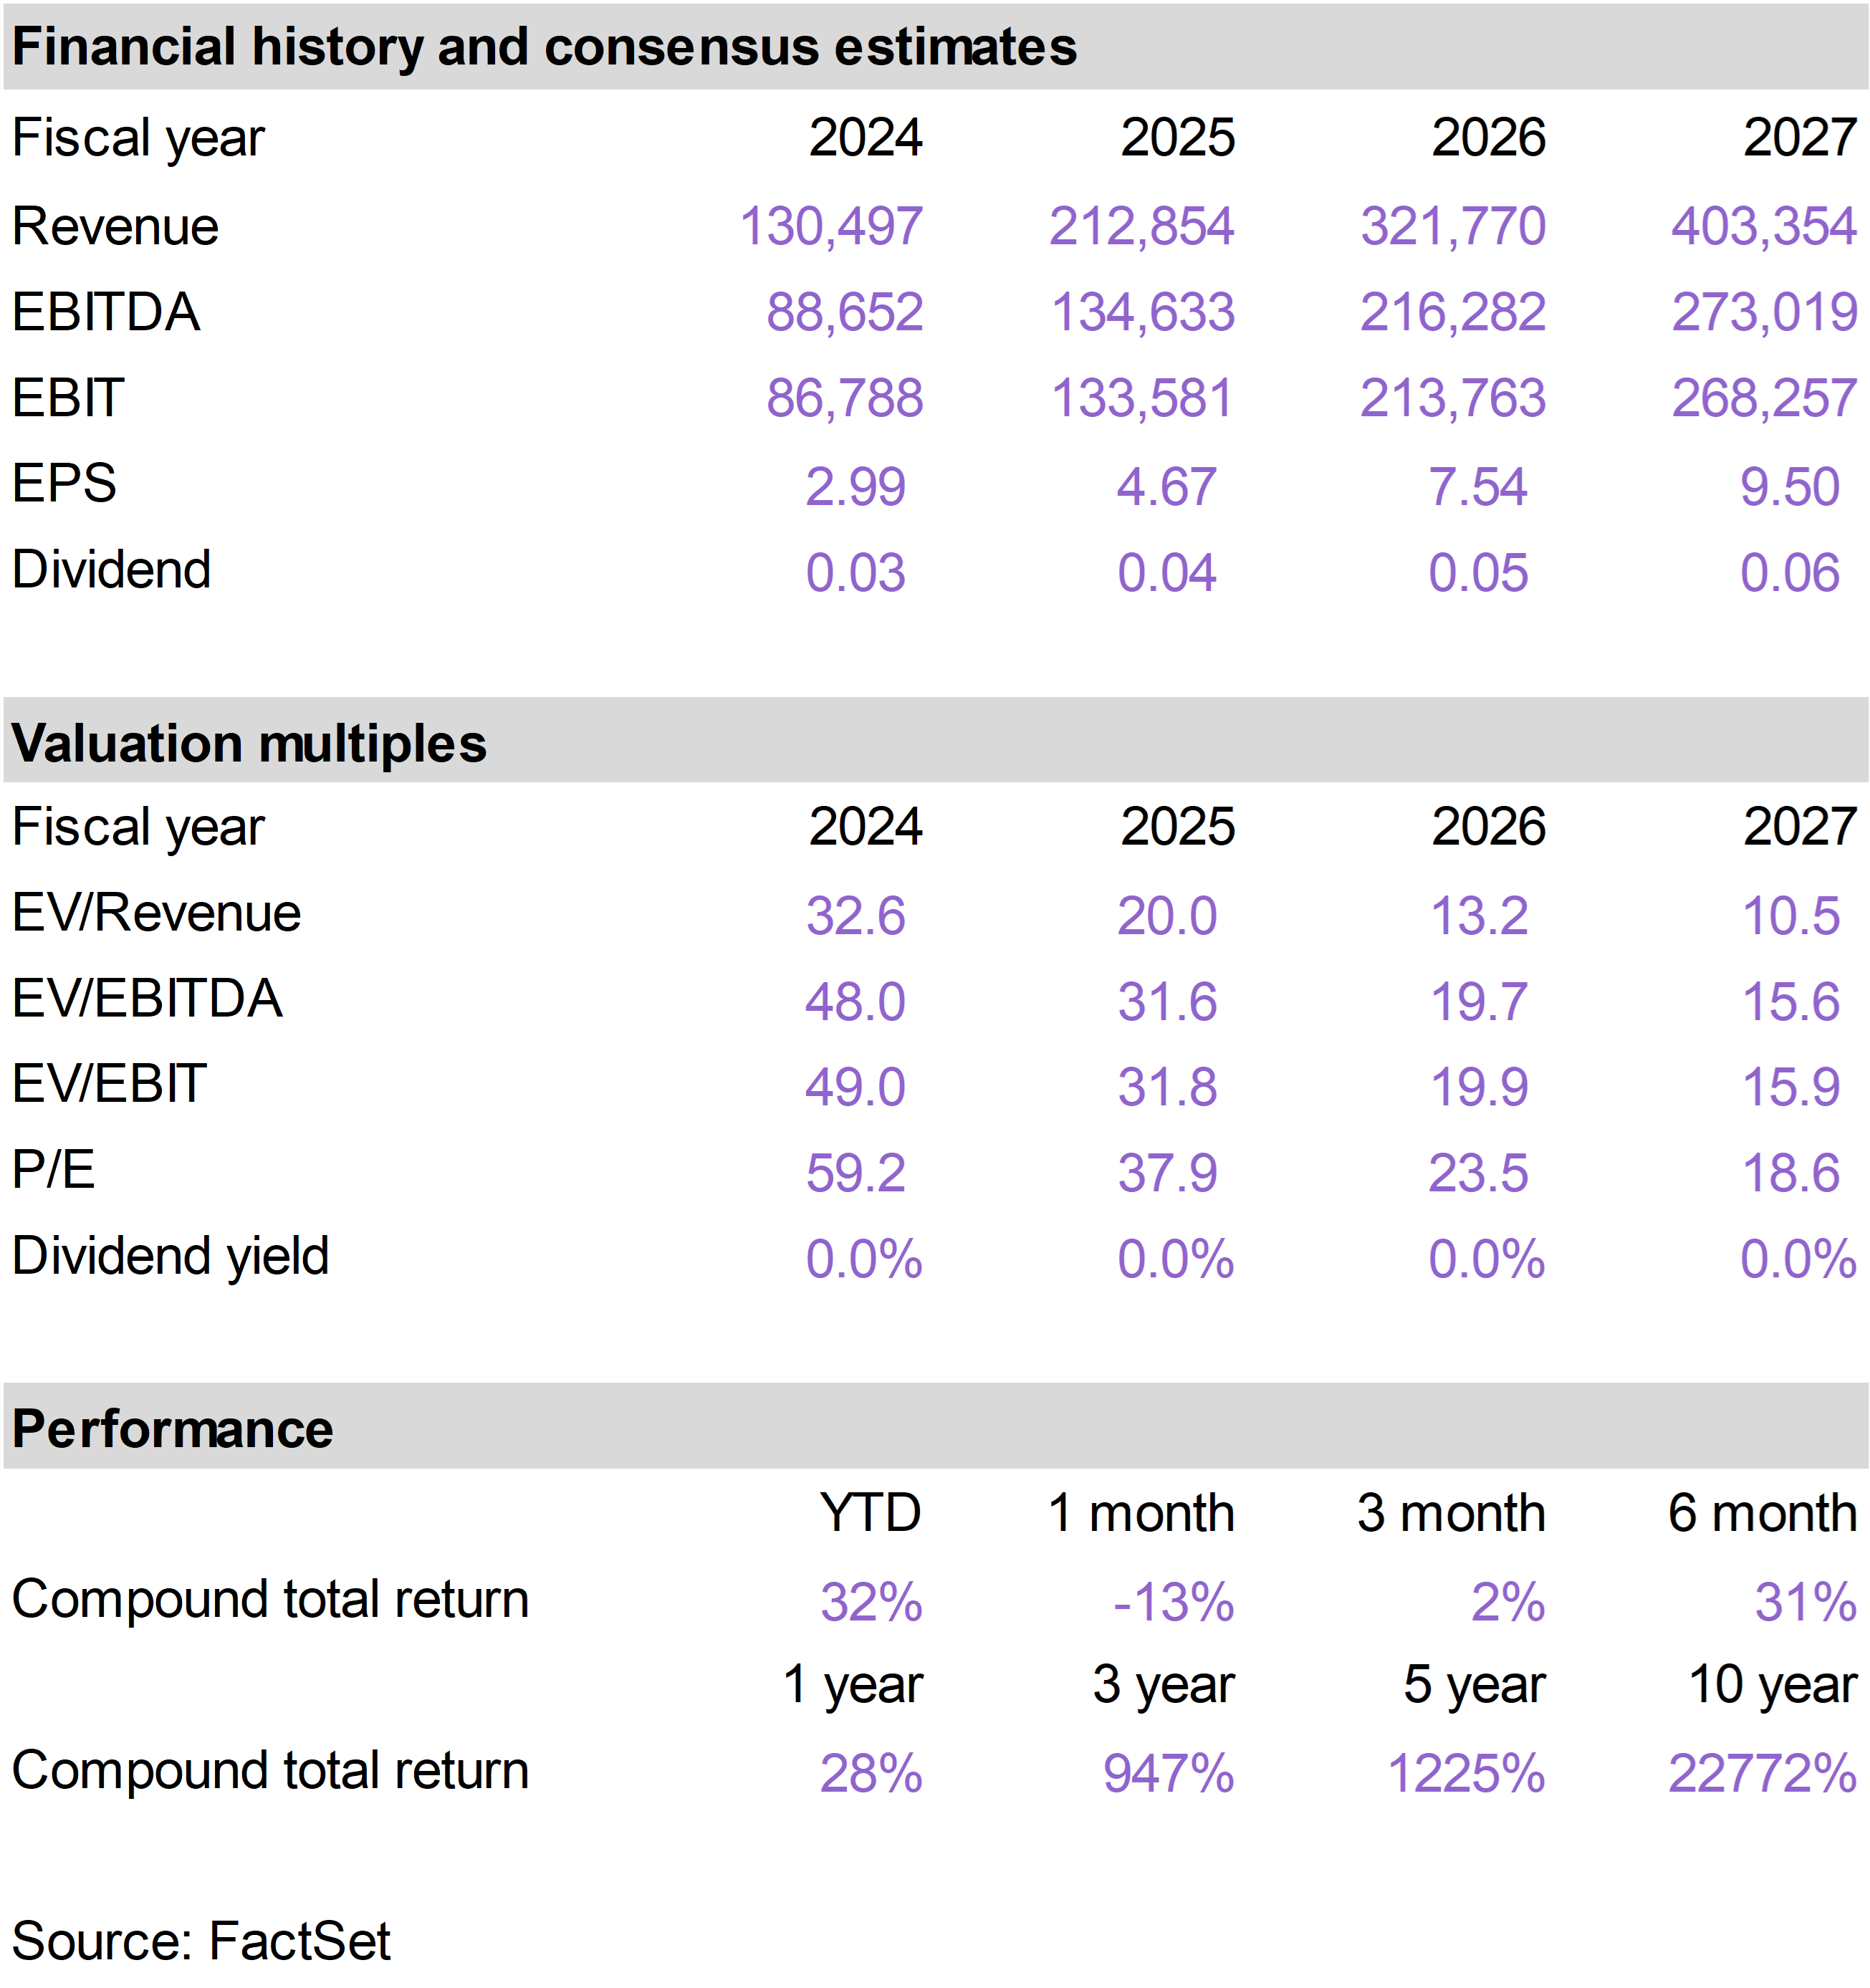
Weakness in NVDA in November is linked to the negative sentiment toward ORCL.


OpenAI’s funding uncertainty raised concerns about the stability of near-term demand, since ORCL is now one of NVDA’s largest hyperscale customers. At the same time, Alphabet (GOOGL) delivered strong results from its Gemini AI model, which added to the narrative that Google may continue leaning into its own internal AI hardware.


Google is increasingly training and running Gemini on its specialized Tensor Processing Units (TPUs), whereas Graphic Processing Units (GPUs)—where NVDA dominates—are more general-purpose hardware.


These headlines overshadowed what were, in reality, excellent earnings from NVDA: data center revenue surged, gross margins expanded, and demand remained exceptionally strong across every major cloud provider.


Progress in TPU development does not necessarily threaten NVDA; in many cases, it can accelerate it. Faster model development at Google raises competitive pressure on other hyperscalers—most of whom rely heavily on NVDA—and expands the total compute footprint required to train, deploy, and fine-tune next-generation models.


While TPUs may play an important role as AI evolves, we are not alarmed. GPUs remain the industry’s foundational compute layer—supported by the unmatched breadth of NVDA’s CUDA software ecosystem, the flexibility to run every major AI model, and a roadmap that continues to define state-of-the-art performance.


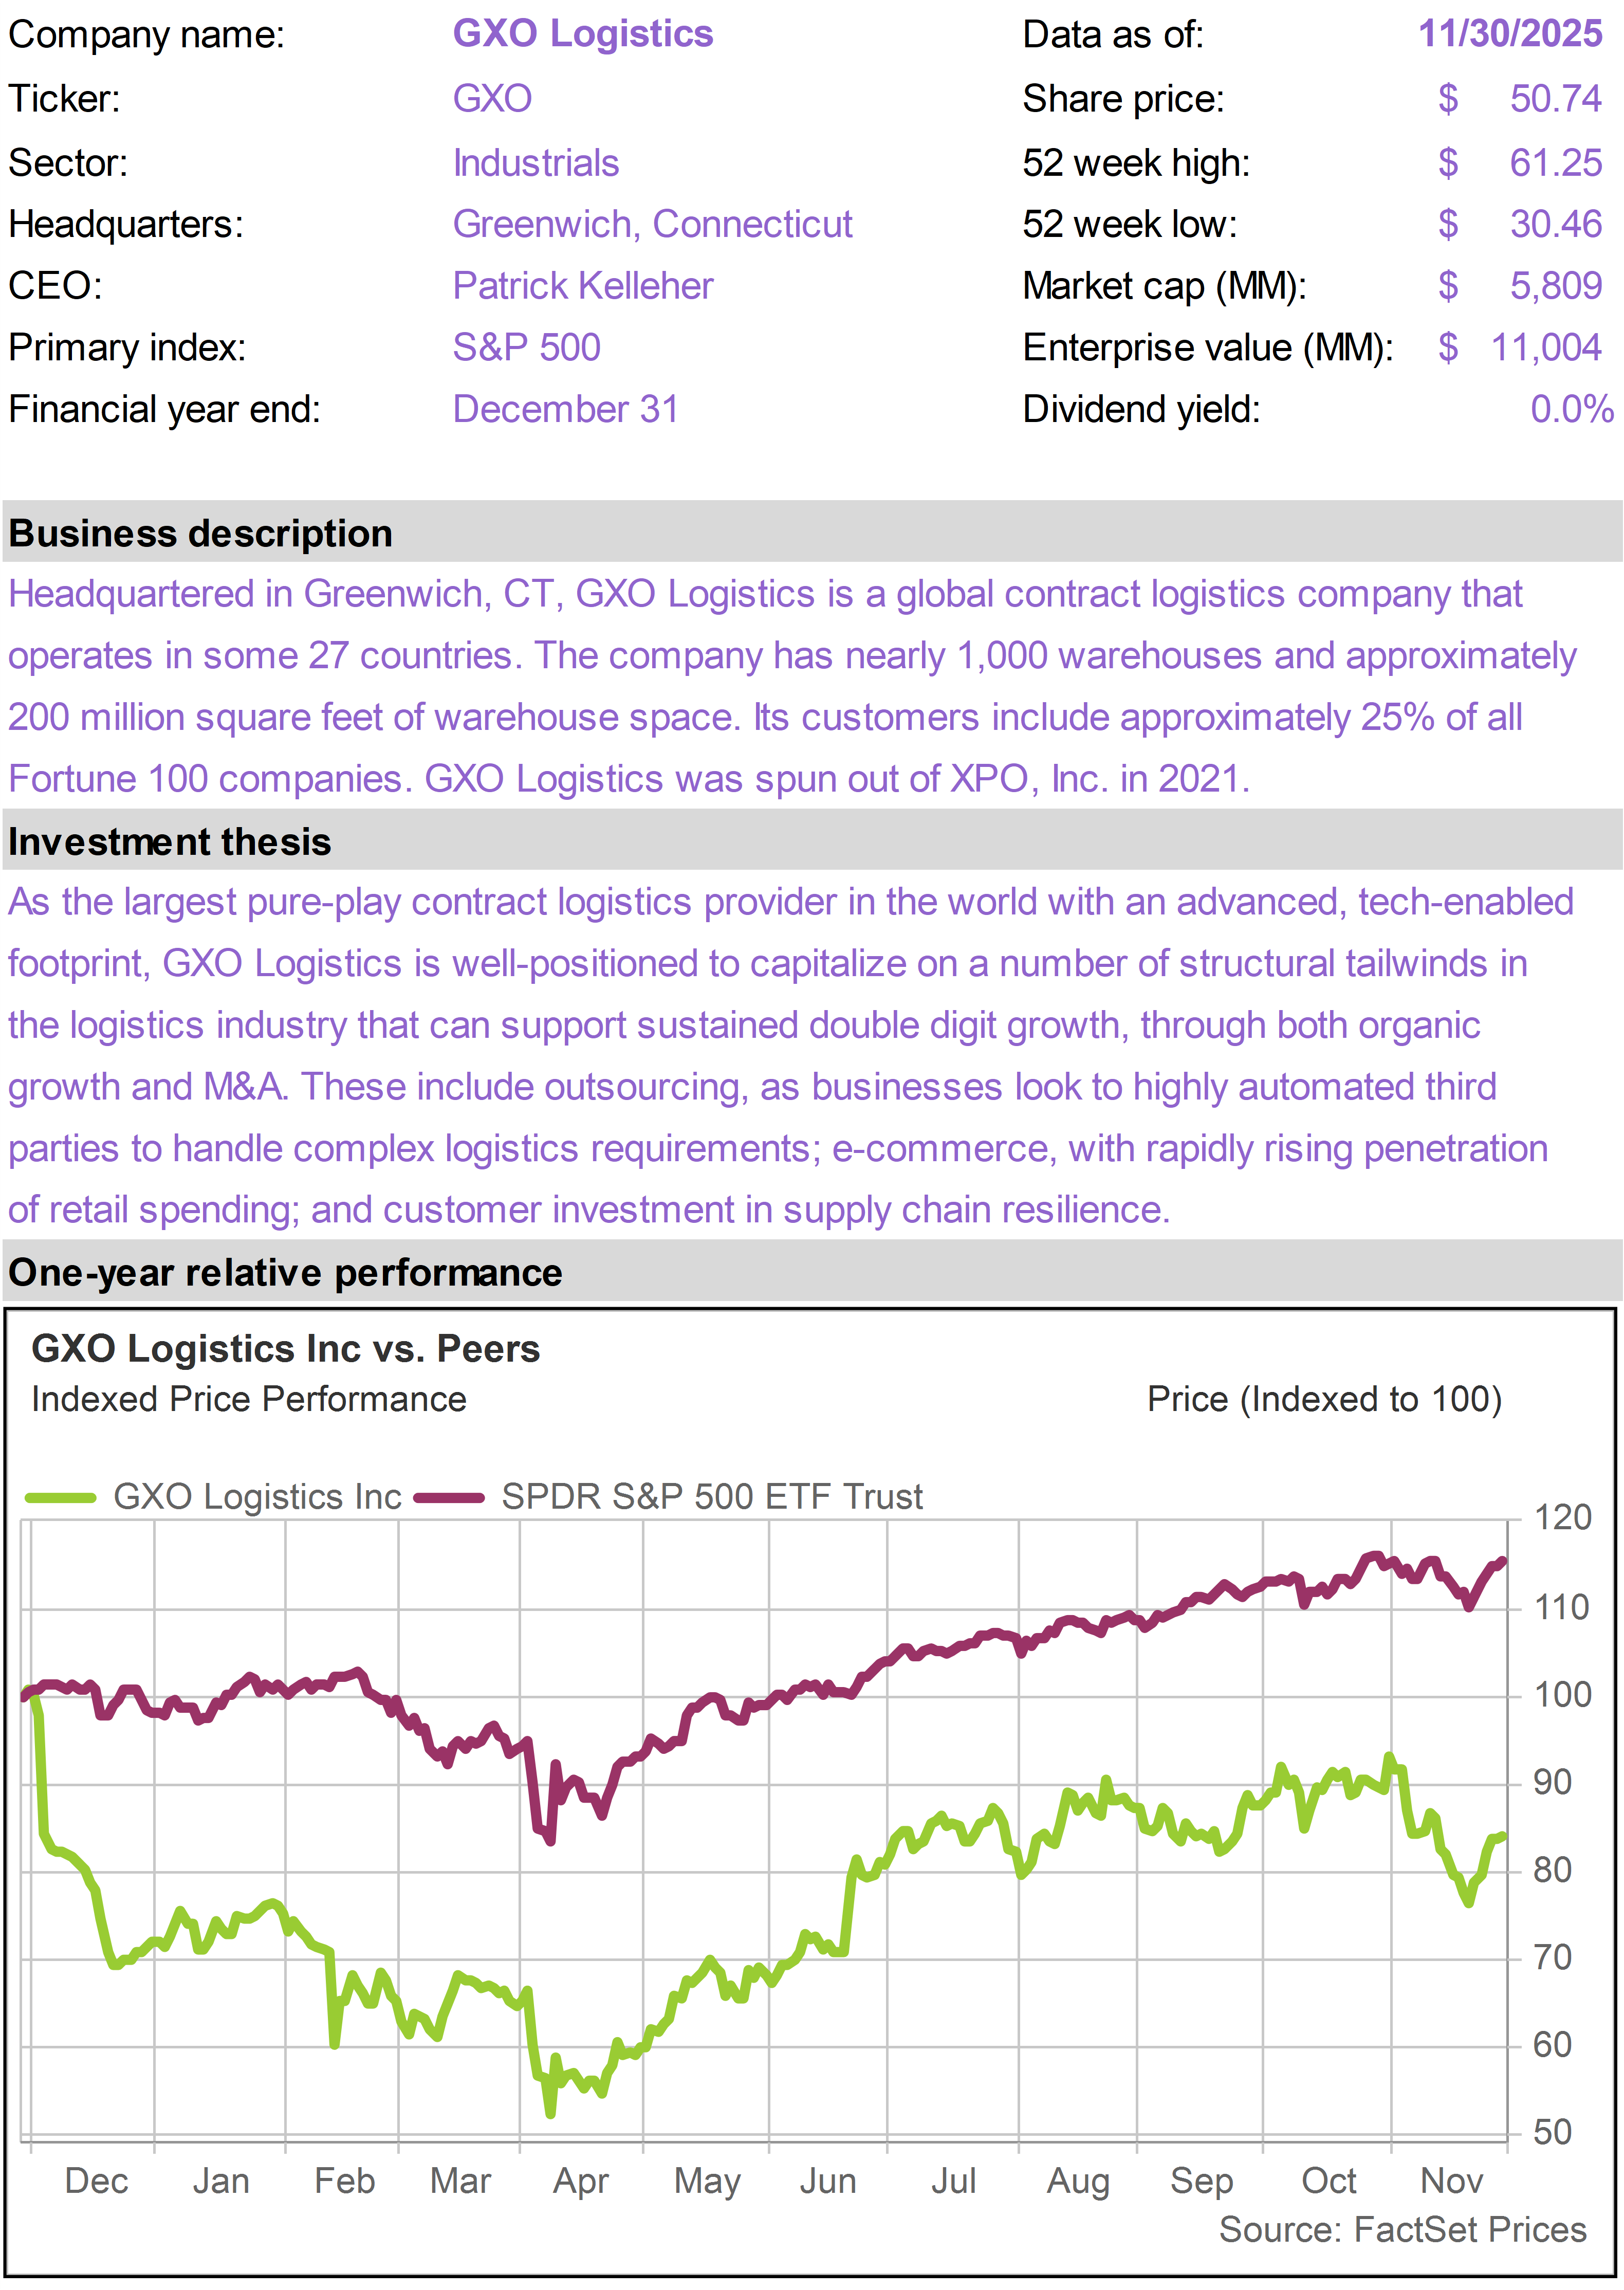
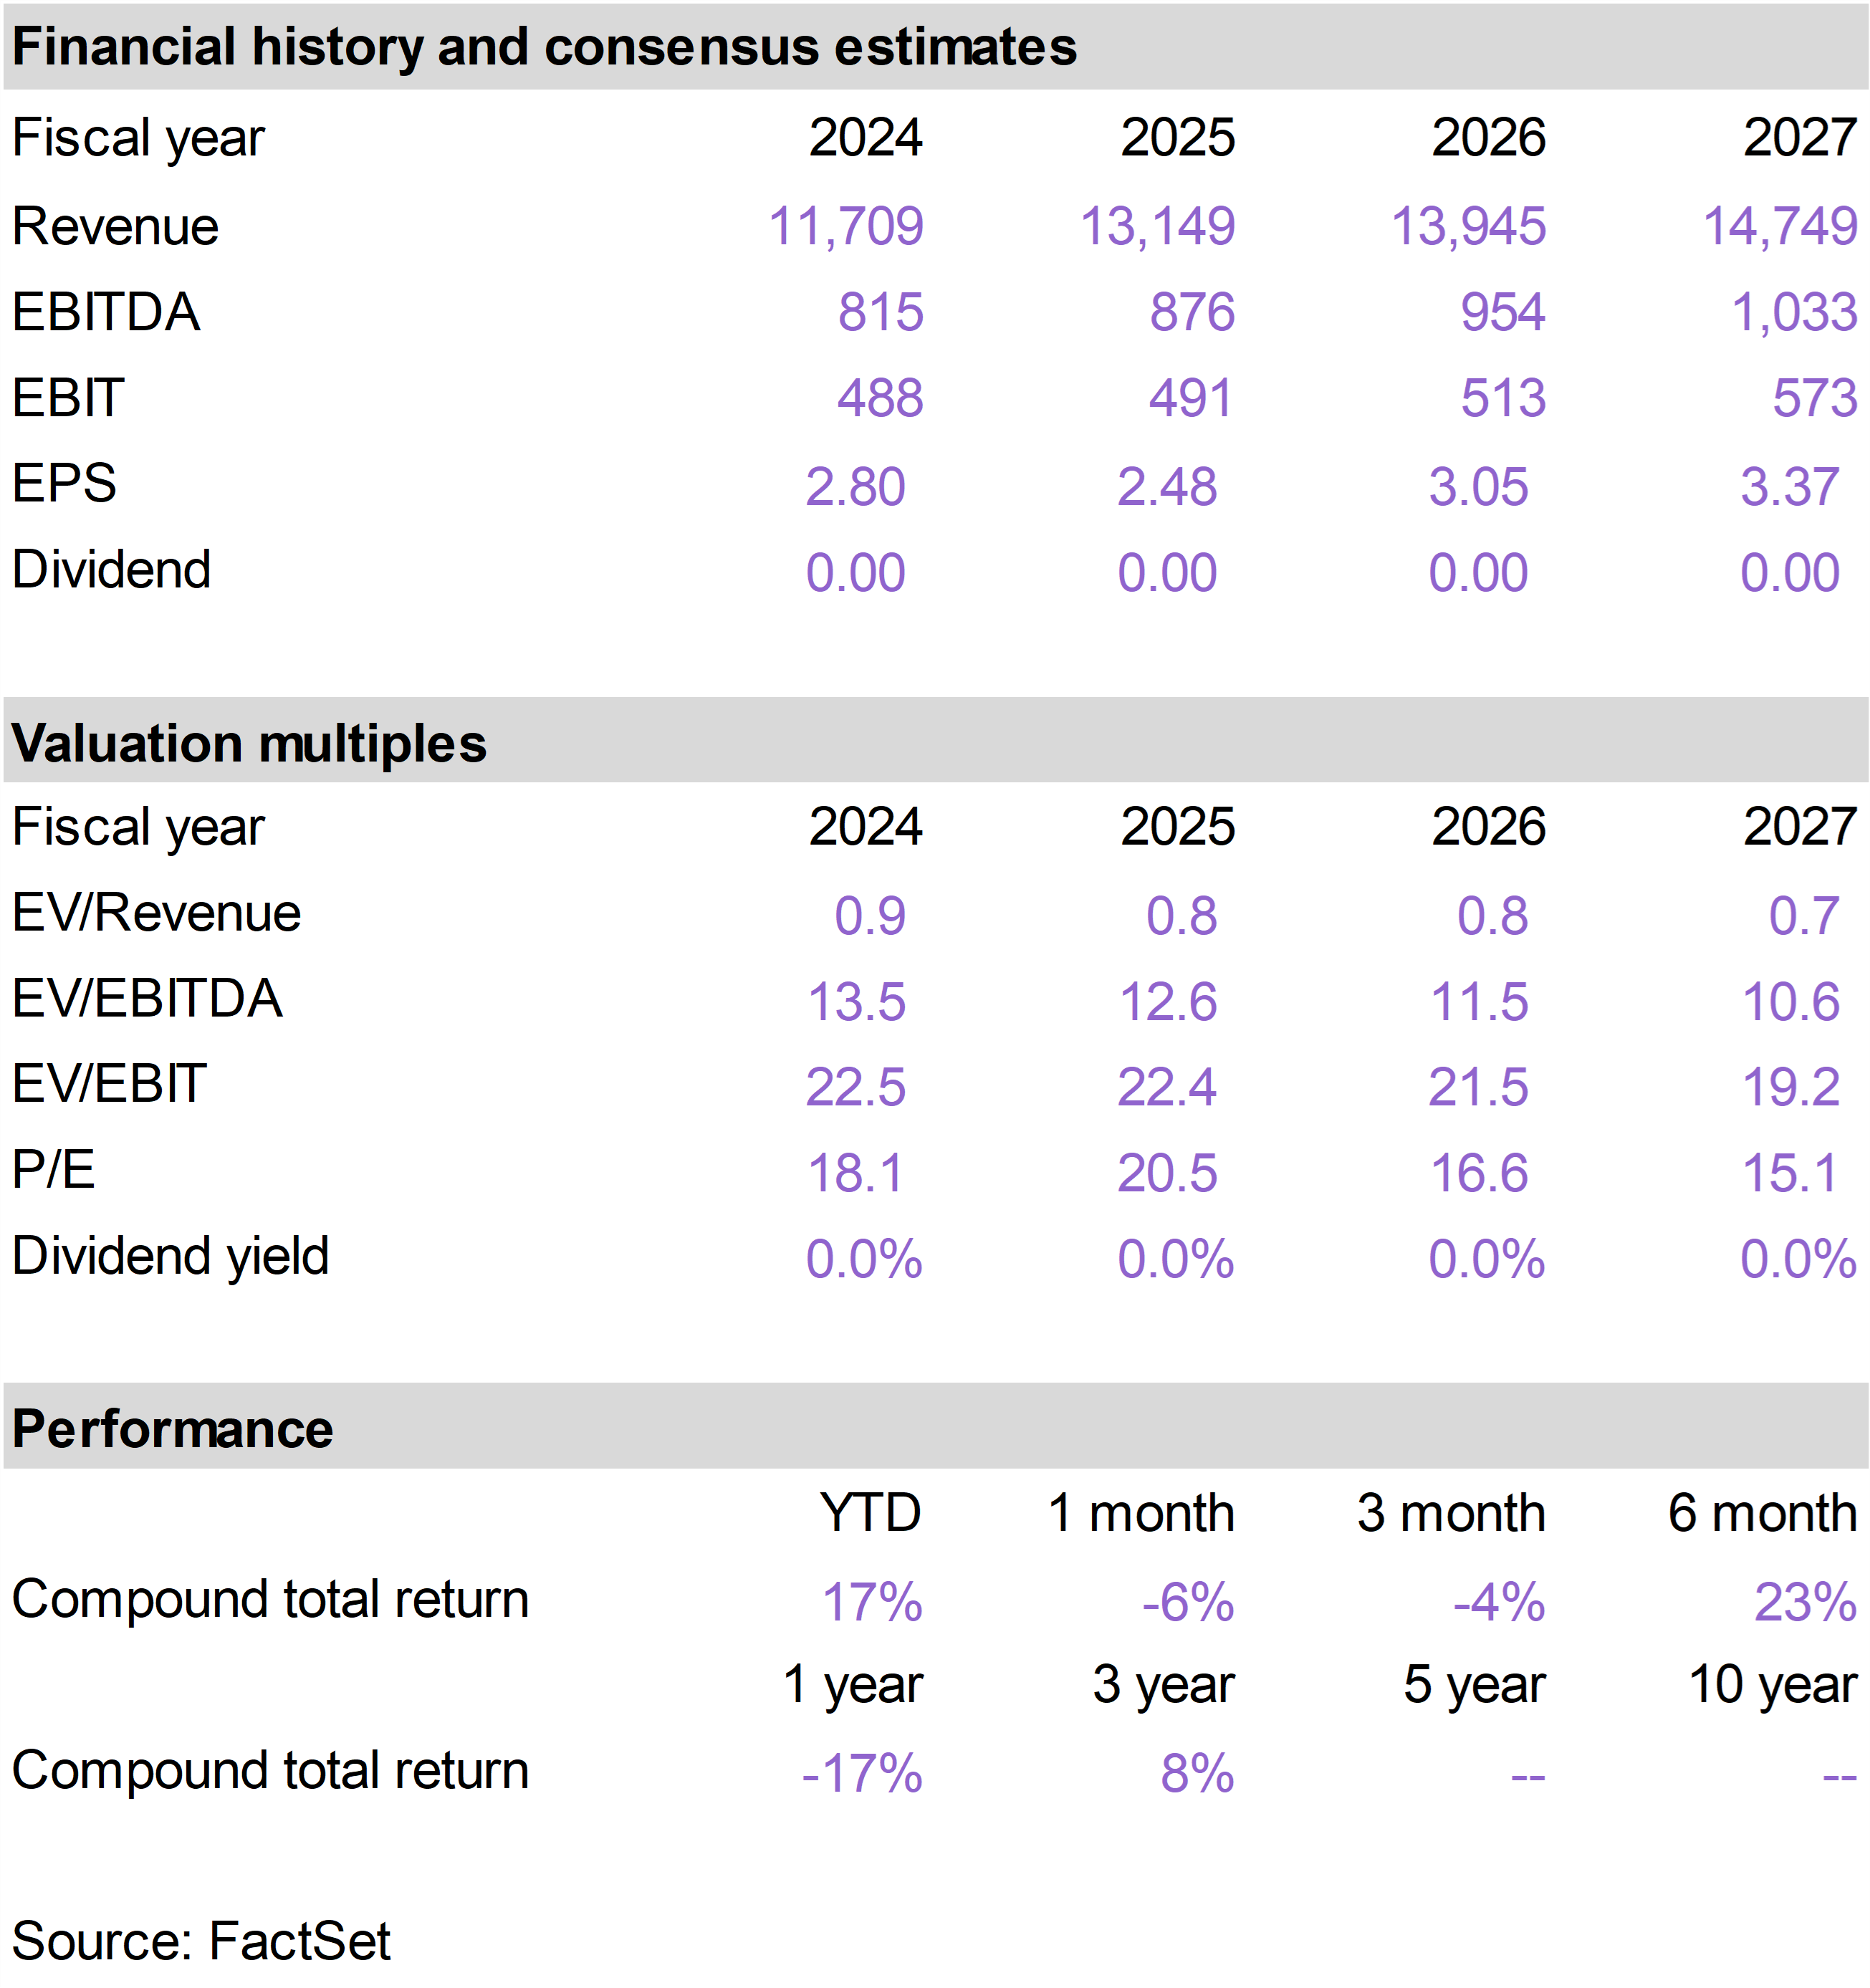
GXO, a provider of advanced outsourced logistics services, underperformed as several retailers and industrial customers signaled more cautious inventory management heading into year-end. Investors also grew concerned that macro uncertainty could delay new outsourcing decisions.


With structurally rising demand for logistics efficiency, robotics, and supply chain resilience, we believe GXO remains well-positioned once cyclical pressures ease.

Key metrics

Valuation detail

Performance detail

Company snapshots

Oracle Corporation (ORCL)

S&P Global (SPGI)

Stryker (SYK)

Texas Instruments (TXN)

Arch Capital Group (ACGL)

Air Products & Chemicals (APD)

Costco Wholesale (COST)

Eaton (ETN)

GXO Logistics (GXO)

NVIDIA (NVDA)

Roper Technologies (ROP)

Thermo Fisher Scientific (TMO)

Union Pacific (UNP)

Visa (V)

Vulcan Materials (VMC)

Williams Companies (WMB)

The 76research American Resilience Model Portfolio is designed to provide exposure to growth businesses that operate with competitive advantages in structurally attractive markets. The objective is to identify businesses that can survive and thrive across different macroeconomic environments and whatever geopolitical crises may unfold. The holdings are intended as long-term investments to drive portfolio compounding with minimal need to realize taxable gains. Emphasis is placed on critical markers of business quality such as barriers to entry, physical scarcity of assets, balance sheet strength, effective capital allocation and durable long-term growth drivers. These assessments are paired with careful consideration of valuation and risk.    

FOR SUBSCRIBER USE ONLY. DO NOT FORWARD OR SHARE.