To determine intrinsic, fair or real value, most financial assets are assessed nowadays through the procedure of discounted cash flow (DCF) analysis, sometimes also referred to as net present value (NPV).
DCF basically applies the mathematical framework that is used to value bonds to any asset that generates cash.
A bond is ultimately just a contractual financial arrangement between a borrower and the bond owner. The convenient thing about valuing a bond is that you know exactly how much cash will be received in the future and exactly when.
You then discount these scheduled cash flows back at an appropriate rate (that reflects credit risk), and you arrive at the intrinsic value of the bond.
Businesses are trickier because you don’t quite know what the cash flows will be. You can make educated guesses, however.
That is exactly what many stock analysts spend their time doing. They project the financial performance of a business many years into the future (often seven to ten).
They then make some assumptions about perpetual growth rates in the last year to calculate a terminal value. The next step is to discount back all those cash flows, along with the terminal value, as if it were a bond.
At the risk of oversimplification, the final steps are to subtract the company’s debt and some other liabilities and then divide the result by the number of shares outstanding… and voila, you have figured out the intrinsic value of the stock.
Does DCF analysis work?
Like counting up the coins in the jar, the discounted cash flow approach to intrinsic value is theoretically sound. The problem is that you are not counting coins but rather tallying up “guesstimates” as to what financial results will be far into the future.
As a result, there is a strong element of “garbage in, garbage out” to the exercise.
Despite his personal connection to Graham and the concept of intrinsic value, Warren Buffet has often indulged in the occasional tirade against DCF calculations. A number is produced, but what does it really mean?
Maybe the best justification for DCF analysis is that it forces the analyst to wrestle with the variables that will drive the profitability of the company. So by merely engaging with the task, an individual can perhaps emerge with an enriched understanding of how a company makes money and its prospects for success.
In most cases, however, DCF modeling involves too much analytical precision to be practically useful. It is also very time consuming.
Most individual investors do not have tens of hours to construct detailed spreadsheets. And to the extent they are interested in researching and analyzing investment opportunities, their time is probably more efficiently deployed in other ways, like reading up on the company and the industry.
Shorthand approaches
The alternative to full-blown financial modeling is using multiples.
The dirty little secret of DCF analysis, which any first year business school student quickly discovers, is that it is ultimately highly dependent on a single multiple of cash flow—just one that is far into the future.
It is not atypical that the terminal value used in a DCF model accounts for something along the lines of 70% of the final calculation. So in a way, DCF’s are just a convoluted exercise of putting a multiple on distant cash flows.
The most commonly referenced valuation multiple is the Price to Earnings or P/E ratio. This simply divides the current share price by reported or expected earnings.
When people throw around P/E multiples, they are not always careful about the “E” to which they are referring. Trailing P/E represents last year’s earnings. Forward P/E could refer to the current year or even the following year.
Since earnings can grow substantially from one year to the next, the year that is being referenced matters a great deal. If someone wants to make a stock sound very cheap (i.e., it has a low multiple), he might use an earnings estimate a year or two out.
Dividend yield
Other commonly used valuation metrics include dividend yield. This is simply dividing the current or expected annualized dividend by the share price.
As we explain in more detail in our Investing for Dividends guide, a dividend represents cash that a company is distributing to shareholders. A dividend is not, however, a direct representation of cash that the company is generating.
So dividend yield is generally correlated with profitability, because boards will typically try to synchronize dividend distributions with profits. But companies do have wide discretion as to how large a dividend they distribute.
Immensely profitable businesses often do not distribute any dividends, while marginally profitable companies sometimes pay dividends that exceed internally generated cash flow.
Other metrics
There are other shorthand metrics that professional investors utilize frequently.
EBITDA (Earnings Before Interest Taxes Depreciation and Amortization) is a somewhat controversial one, since it excludes certain costs to the business that are quite relevant. But it has its uses when analysts want to focus on the core operating profitability.
Free cash flow (FCF) is rarely referenced outside of professional circles but is regarded by many sharp investors as the most relevant. FCF strips away certain accounting assumptions and distortions and tries to capture real movements of cash within a company.
A stock’s free cash flow yield represents the cash that can be theoretically released to shareholders without causing the business to increase its debt (divided by the share price). It basically compares the extra cash a business generates in any given period (after every conceivable use of cash is accounted for) versus the share price of the stock.
Working backwards
Multiples are imperfect. But investors need some way to calibrate value and figure out what they are actually getting for their money when they buy into a business by buying a share of stock.
When share prices adjust sharply in market downturns, you also get the opportunity to think about how a company’s valuation compares to where it previously traded. If the adjustment seems too radical, this could signal a valuation opportunity.
In this context, looking at changes in multiples is useful for understanding the extent to which the market’s implied valuation of the business has moved.
One of our most recent Model Portfolio additions was NVIDIA (NVDA) on March 12, 2025. See American Resilience Stock Pick for our discussion of this change.
As we have acknowledged on many occasions over the past year, NVDA is an extraordinary business, but we have been kept on the sidelines by a somewhat rich valuation.
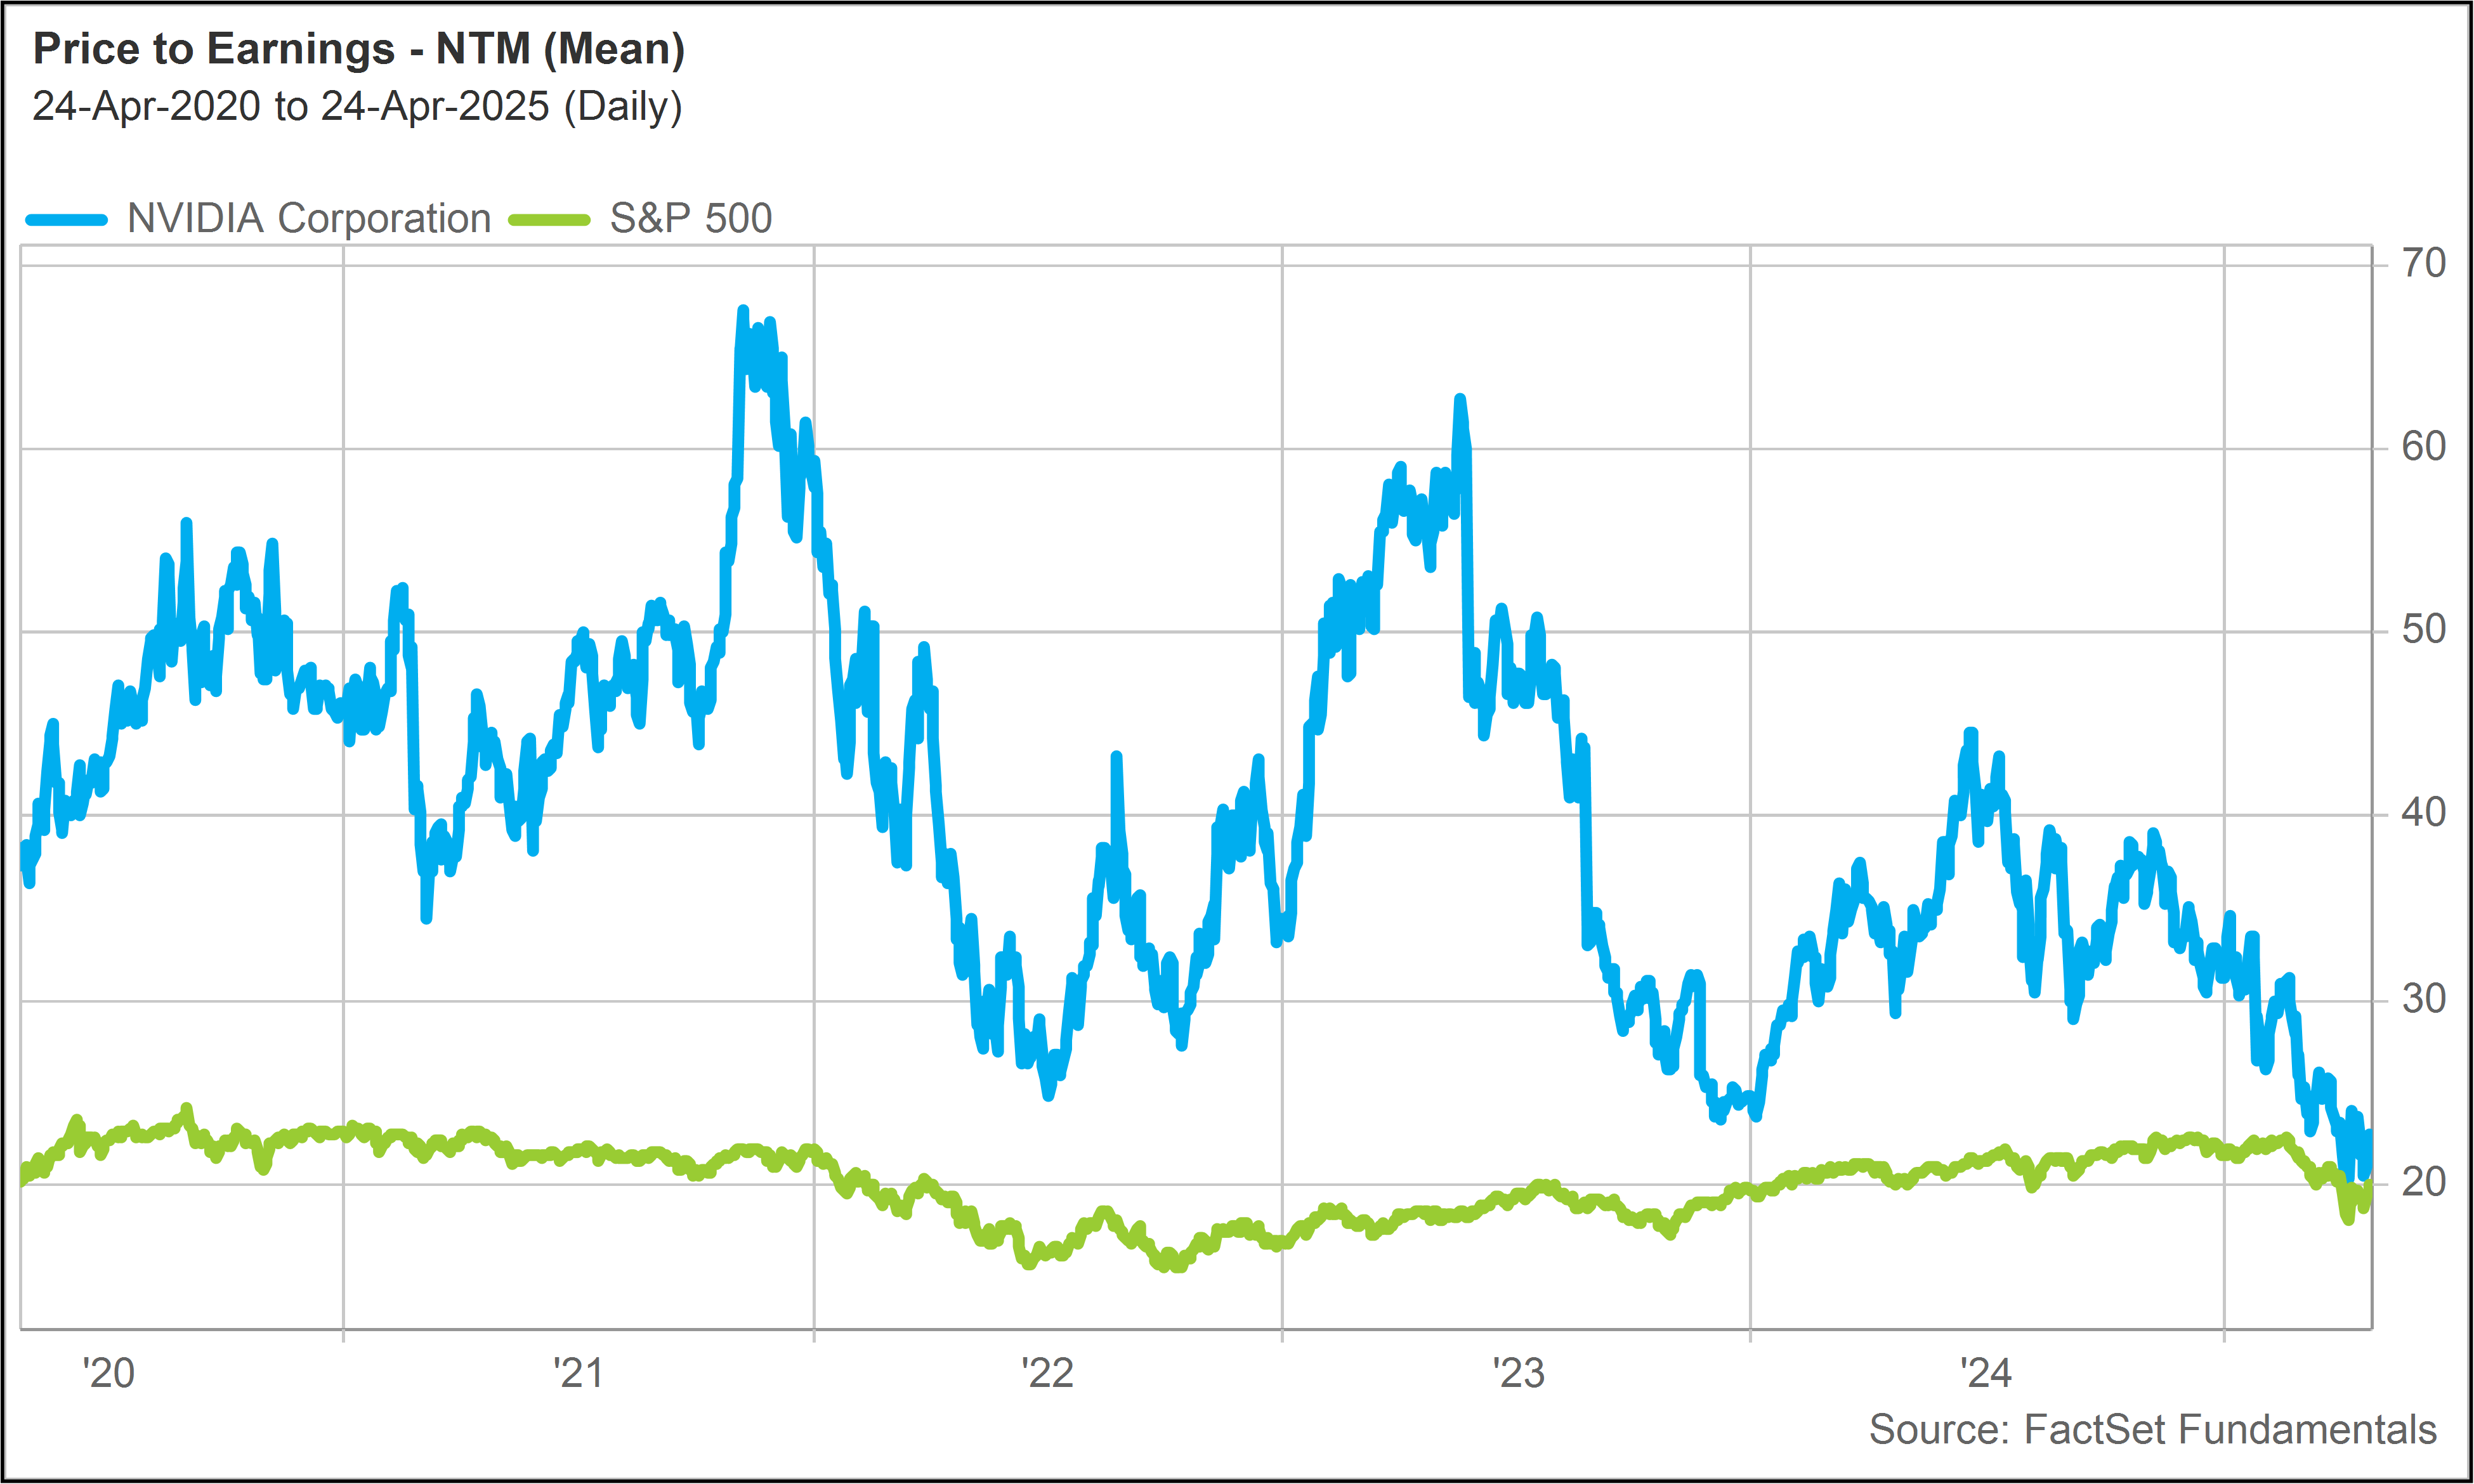
What motivated us to make this portfolio change was the severe collapse in NVDA’s valuation metrics, which was precipitated by the tariff sell-off.
NVDA’s forward P/E ratio has collapsed dramatically in absolute terms and has converged on the overall S&P 500 earnings multiple (around 20 times).